
Ultra-fast planning, extremely simple
Make a dashboard with ChatGPT
from the spreadsheet on your board.
For founders with the month's numbers in a spreadsheet: upload the file to a Storyflow board, ask ChatGPT, and get a row of metric tiles and charts built from the real values.


Creatives working for these brands already got early access
- Red Bull
- Canon
- Artlist
- Porsche
See how easy it is to get started
Watch a real project come together, from a blank board to a finished plan, clicked through step by step.
Start from a ready-made template
Pick a board to see what you can build, then let AI fill it in. Every template is a real, editable starting point on the same infinite canvas.

Mind Map
Branch one central idea out into themes and sub-points, then drag the connections around until the structure makes sense.
Can ChatGPT make a dashboard from a spreadsheet?
ChatGPT can read a spreadsheet and work out which numbers matter, so yes, but on its own it draws the charts inside a chat that nobody else on your team opens. Storyflow is an AI visual workspace that turns a spreadsheet into a dashboard on one infinite canvas: a row of metric tiles, bar, line and pie charts, the source file beside them and the notes that explain them. Connected to Storyflow, ChatGPT reads the CSV or Excel file sitting on your board and builds the tiles there, on its own model, so it uses no Storyflow AI credits.
A dashboard that a reader takes in within a minute has three layers, whoever builds it. On top, three or four single numbers with the change since last period. Under them, one or two trends over time. At the bottom, one breakdown that explains the trend. Seven tiles is plenty. Storyflow lays out up to 16 in a grid, and ChatGPT is told to put the metric row first and never to invent a tile to fill a gap.
A worked example. A founder uploads metrics-2026.csv: twelve rows, January to December, with columns for monthly recurring revenue, new customers, churned customers, cash in the bank and revenue by plan. She asks for a board dashboard for investors. The top row gets four metric tiles: MRR $42,300, up 6.0% on November's $39,900. Customers, 318. Monthly churn, 2.1%. Runway, 14 months, which is $588,000 in the bank divided by a $42,000 monthly burn. The second row is a line chart of MRR over the twelve months and a bar chart of new against churned customers. The third is a pie of revenue by plan: Starter 22%, Growth 53%, Scale 25%.
The file has to be on the board for ChatGPT to read it from Storyflow. Upload the CSV or the Excel workbook to the board like any other file. A file you attach in the ChatGPT chat stays in ChatGPT: it can read the numbers there and still build the tiles on your board, but the file itself is not copied across. Long files come back cut short, and ChatGPT is told when that happens. Monthly or weekly totals read whole. A raw export of every order does not, so give it the summary sheet.
After the dashboard is built you change it by asking. "Make the customers chart horizontal" or "add December to the MRR line" edits the chart that is there and keeps its place on the board. What ChatGPT cannot do is swap a whole dashboard for a new one, or turn a bar chart into a line chart: a second request builds a second set of tiles beside the first. There is also no live link to your spreadsheet. Next month, upload the new file and ask again.
The same steps work for an agency with a client's numbers. Put the campaign export on the client's board and ask for reach, clicks, cost per lead and spend against budget. The tiles sit beside the campaign plan, so the client reads the result next to what was promised. Everyone you invite to the board sees the dashboard without opening ChatGPT at all.
Ultra fast from brief to board
From a spreadsheet to a dashboard in four moves.
About ten minutes the first time, most of it spent checking the numbers.
01
Connect ChatGPT to Storyflow once
In ChatGPT on the web, open Settings, then Security and login, and turn on Developer mode. Go to chatgpt.com/plugins and click the plus button. Name it Storyflow, choose Public endpoint and paste https://mcp.storyflow.so/mcp. Create it, sign in to Storyflow and pick the project that holds your numbers.
02
Put the spreadsheet on the board
Upload the CSV or Excel file to the board where the dashboard should live. Use the sheet with the totals, one row per month or per week, with a header row that names each column in plain words. That header is what ChatGPT reads to know what each number is.
03
Ask for the dashboard and say who reads it
For example: "Read metrics-2026.csv on the Investors board in Storyflow and build a dashboard: four metric tiles on top, MRR over time, new against churned customers, and revenue by plan." Naming the reader matters. An investor dashboard and a team dashboard pick different numbers from the same file.
04
Check the numbers, then ask for changes
Open the board and compare each tile with the file beside it. Ask ChatGPT to fix a label, flip a chart or add a target line. Move the tiles where you want them, and write the two sentences of context a number always needs in a note next to it.
The file, the tiles, the client and the note.
ChatGPT reads the numbers and decides what to show. Storyflow draws it where your team can see it.
Reading
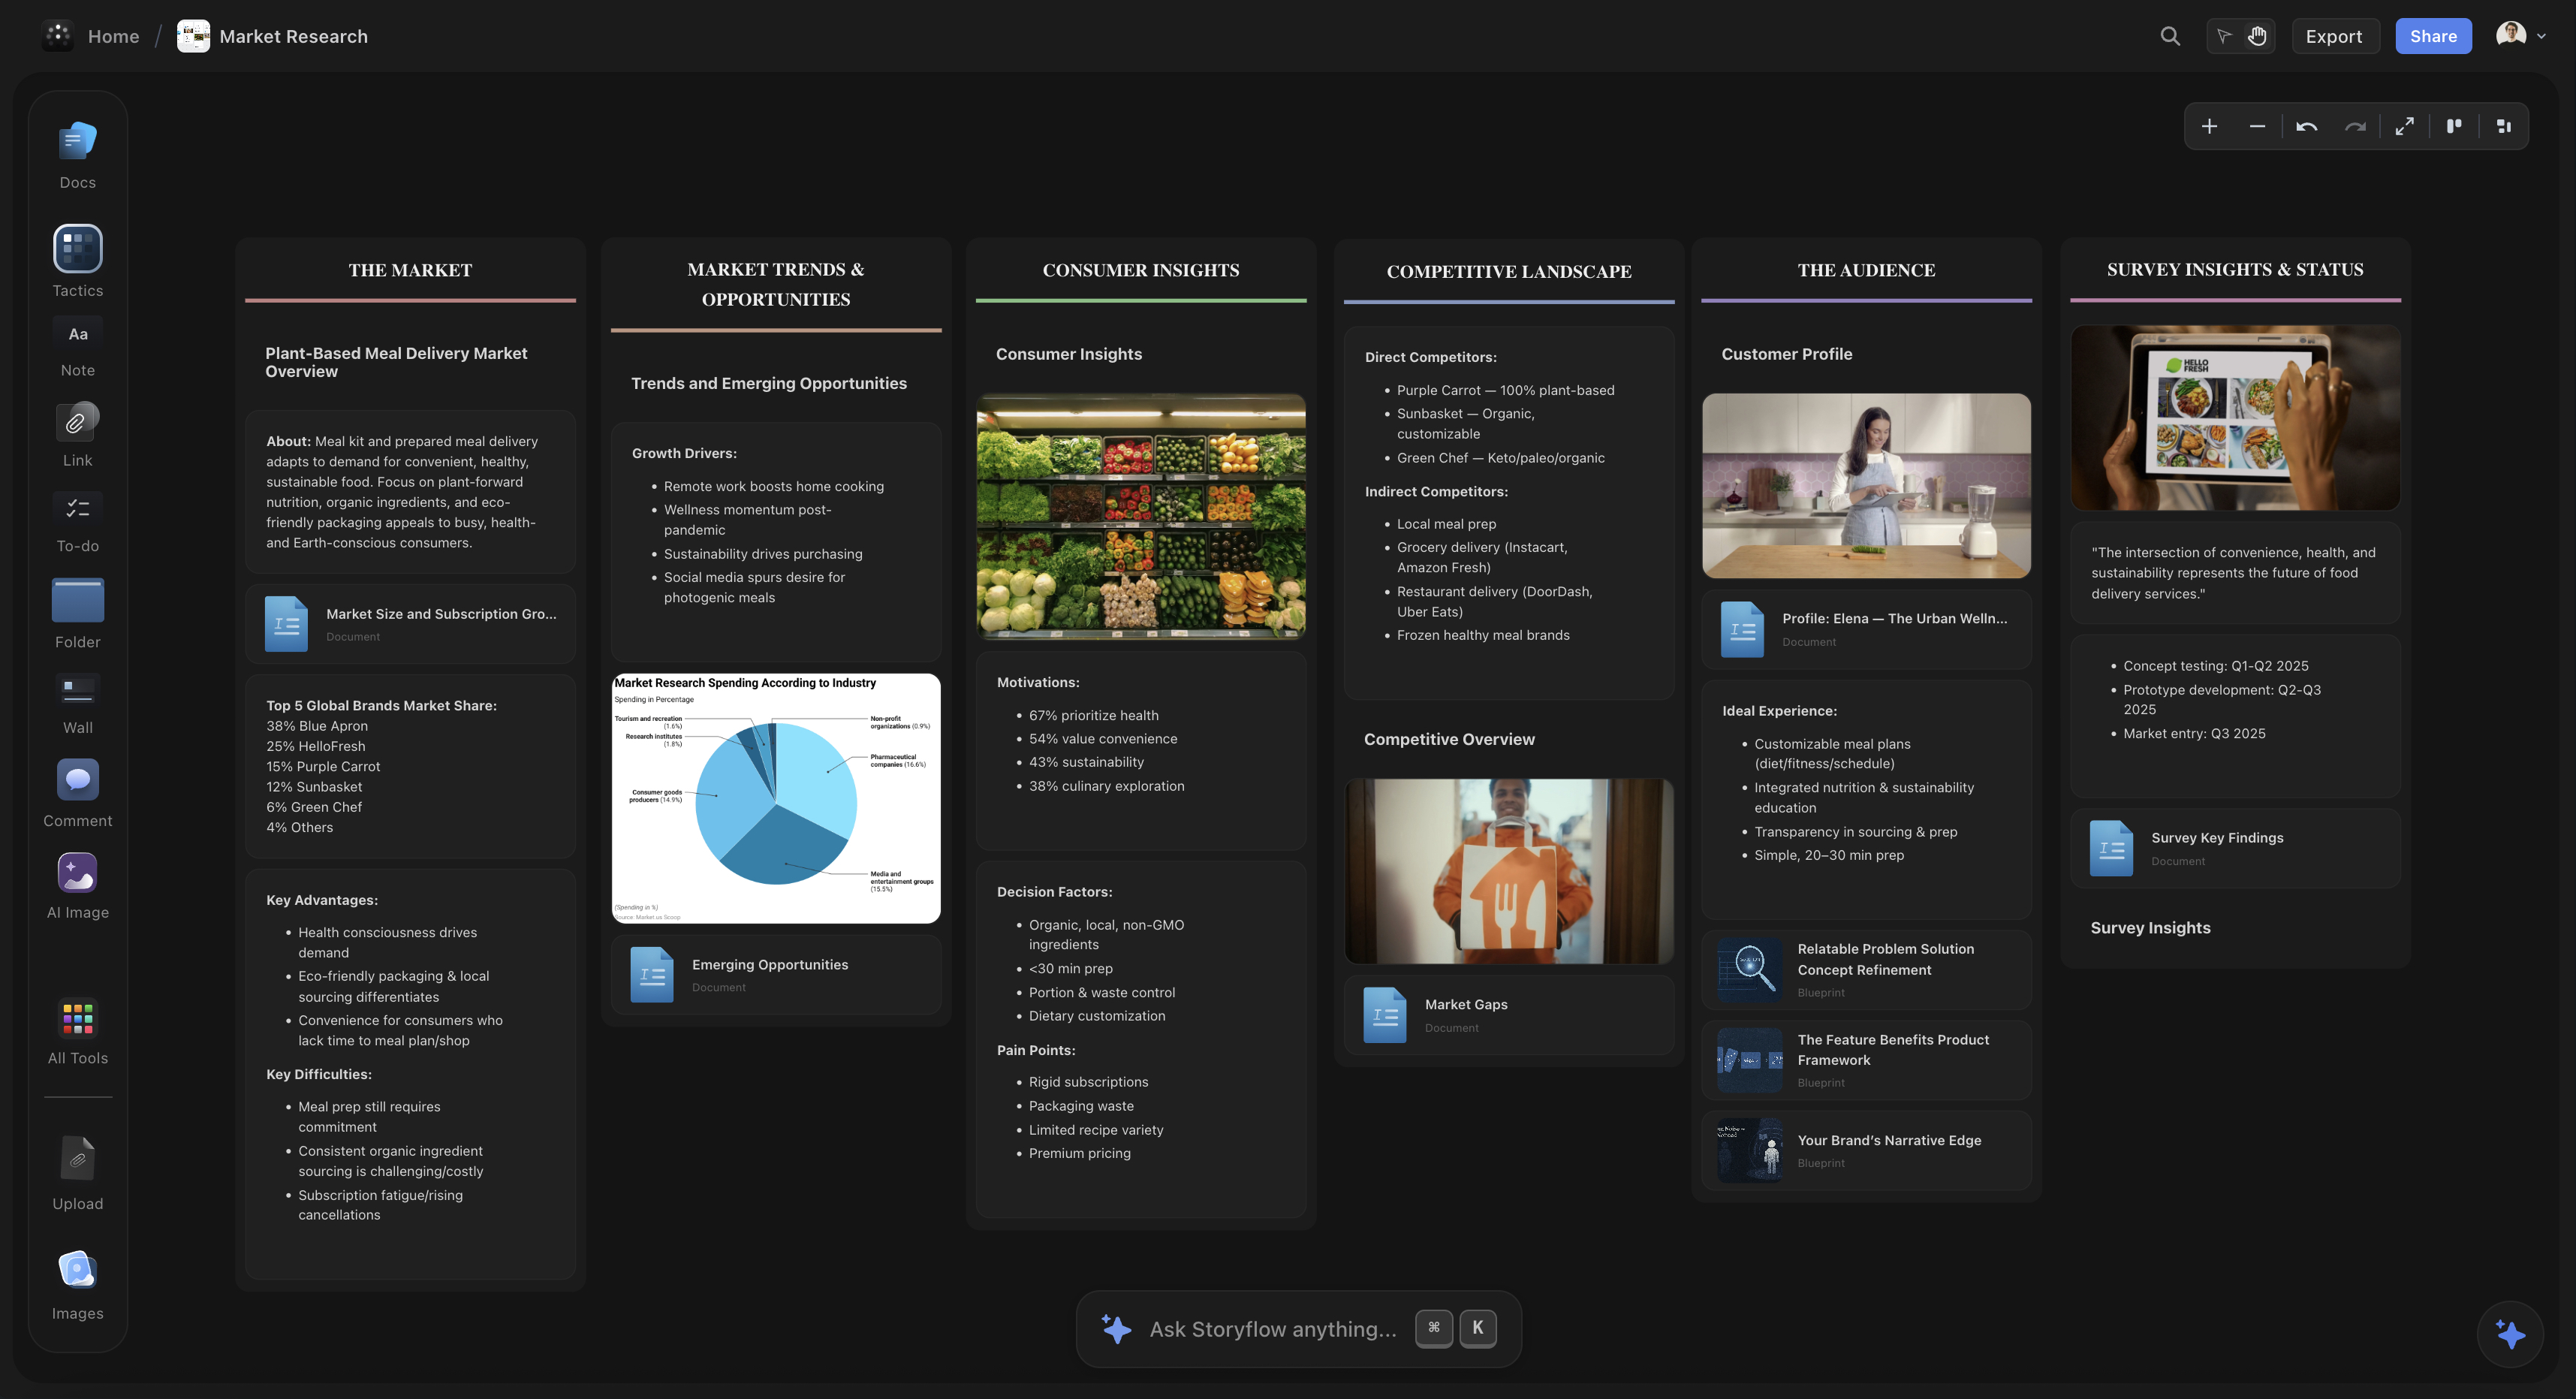
It reads the real file, not your summary of it
ChatGPT opens the CSV, Excel, PDF or Word file that sits on the board and reads its text and rows. It is told never to answer from a file's name alone. A file of up to 25 MB can be read, and a long one is cut short with a note saying so.
See project memory →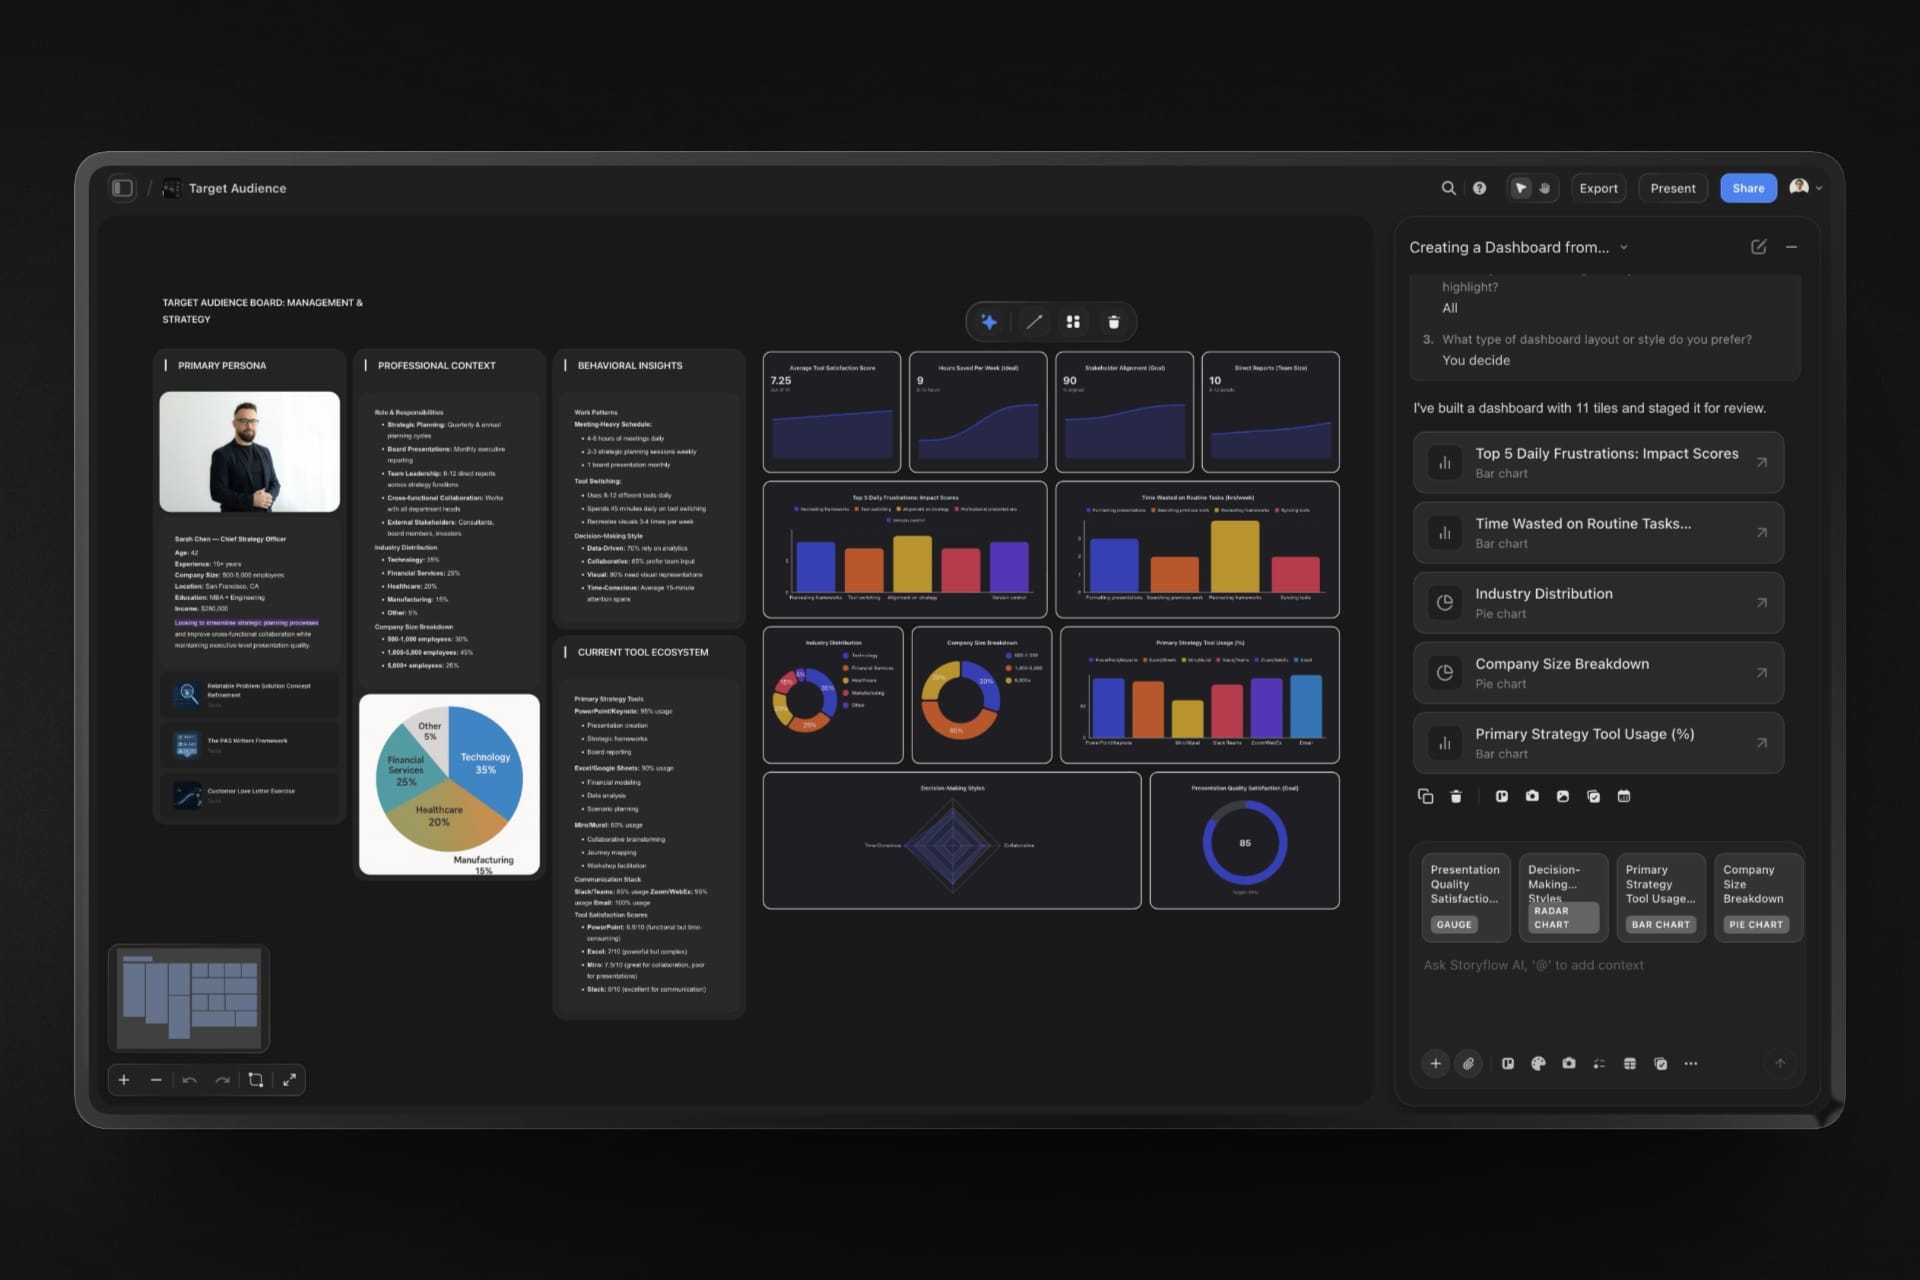
The tiles
Metric tiles on top, charts underneath
One request builds the whole grid. A metric tile shows the headline number, a small trend line when there is a history, and the change as a percentage. Under the metric row come bar, line and pie charts, and a gauge, a radar or a scatter chart when the data calls for one.
See the investor update template →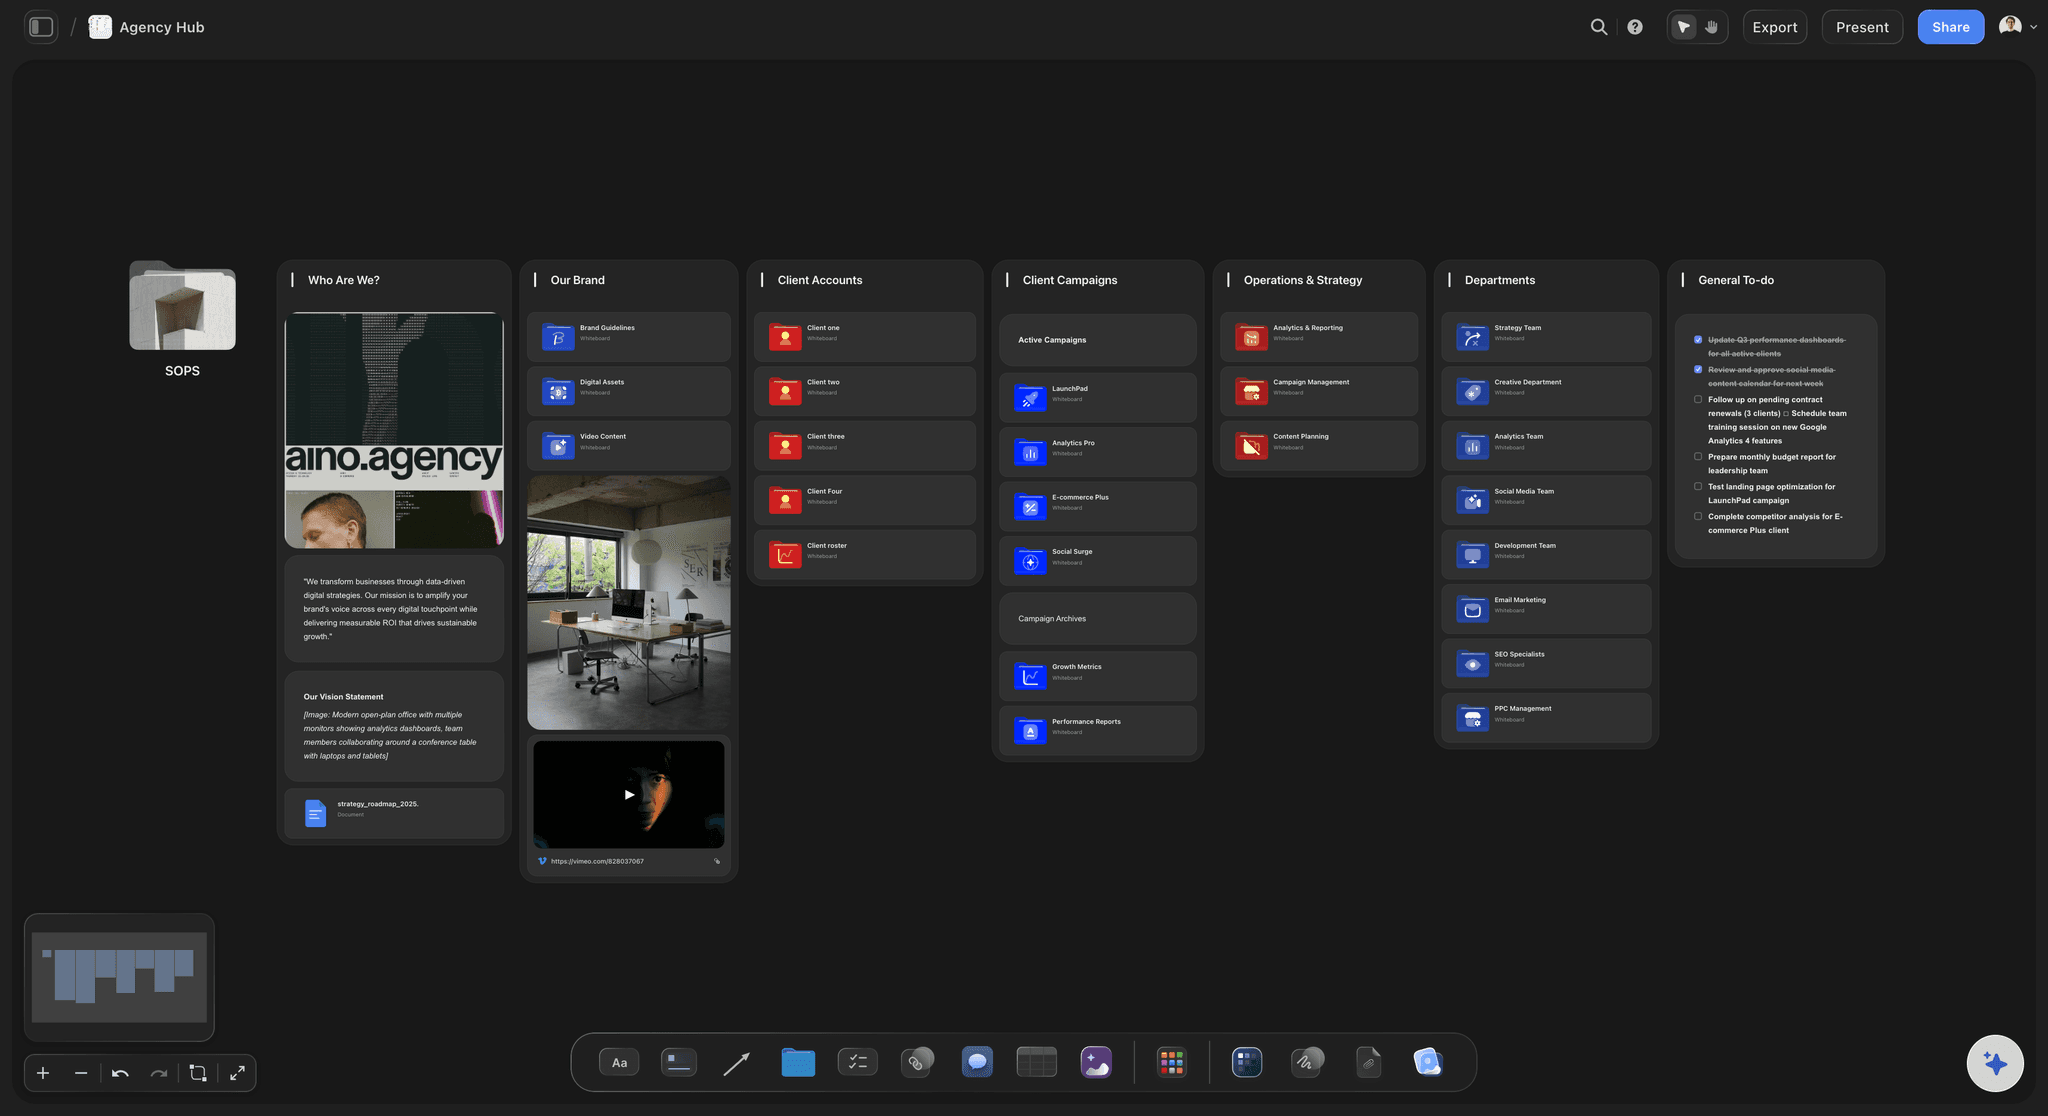
For a client
The client's numbers on the client's board
An agency keeps one board per client. Put the month's export on it and ask ChatGPT for the dashboard there, so reach, clicks and spend sit beside the campaign they came from. Pick only that client's project when you connect, and ChatGPT cannot see the others.
See the client report template →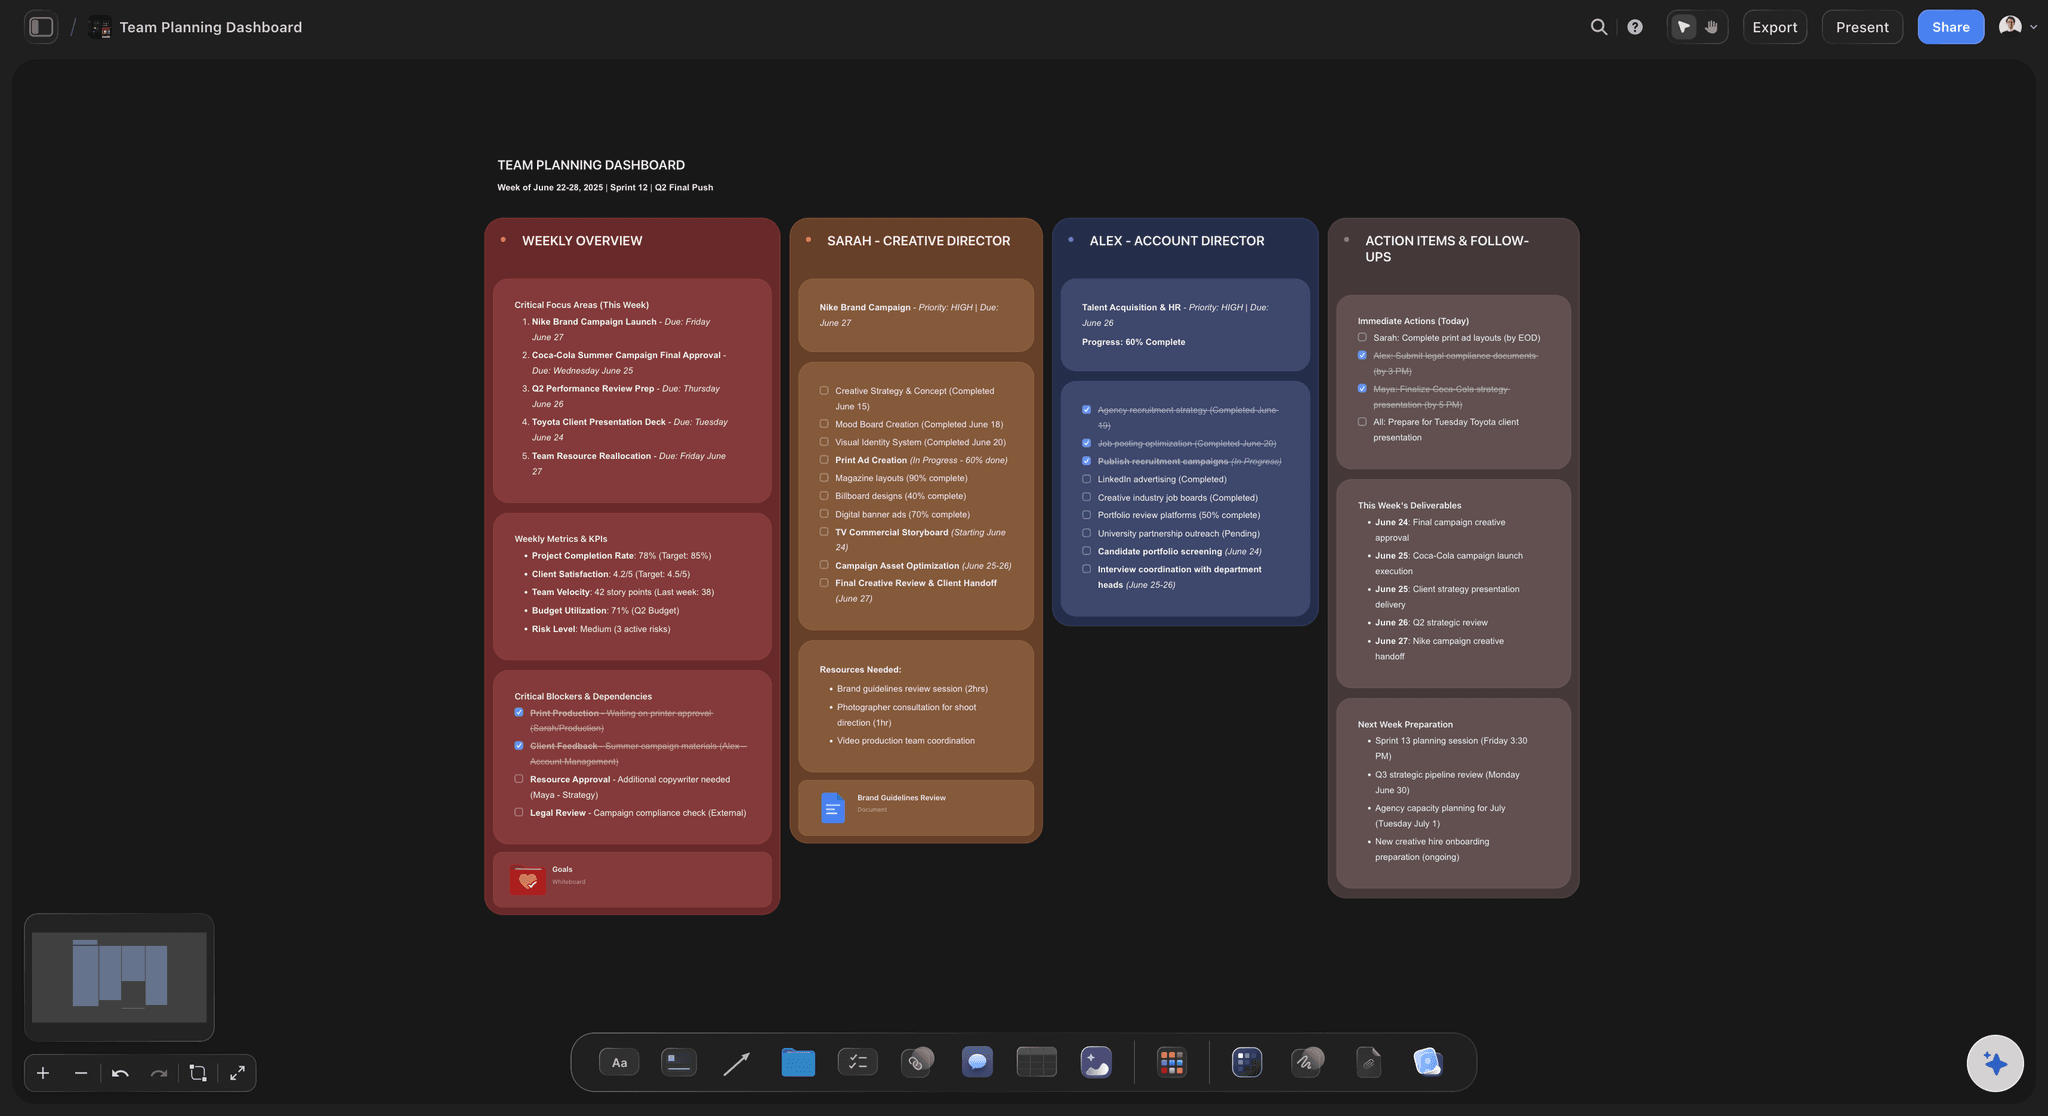
The words
A note that says what the numbers mean
A dashboard without a sentence of context gets misread. Ask ChatGPT to write the short note for the board: what moved, why, and what you will do about it. It lands as a note or a document next to the tiles, and you edit it in your own words before anyone reads it.
See client updates from ChatGPT →ChatGPT does the work. Your Storyflow plan does not pay for it.
ChatGPT runs on its own model, so building charts over the connector uses no Storyflow AI credits. A free account (today, one invited by a paid member) gets 50 actions a week from its assistant, and Plus, Pro and Max have no limit. Storyflow is paid-only during early access, with plans from $7.99 a month billed annually ($9.99 monthly). A free plan launches before the end of 2026, and anyone a paid member invites to a board joins free.
No Storyflow AI credits spent on anything ChatGPT builds
A dashboard from one file is about five actions: find the project, find the board, read it, read the file, build the tiles
No limit on connector actions on Plus, Pro and Max
Invite your cofounder, your investors or your client to the board free
Pick which projects ChatGPT may see, and whether it may change them
Built for people with taste
Where a dashboard made in a chat falls short.
ChatGPT is good at picking the numbers. The trouble is where the charts end up.
The chart in the chat
A chart only you can see
It lands where the team works: The tiles are built on the project's board, not handed back as pictures in a reply. There is nothing to screenshot and paste into a slide before anyone else can look.
Nobody else needs ChatGPT: Your cofounder or your client opens the board in Storyflow and sees the dashboard. They do not read the conversation that made it, and they do not need a ChatGPT plan.
The file stays beside the charts: The spreadsheet sits on the same board as the tiles built from it, so a reader who doubts a number opens the source right there instead of asking you for it.
Each tile is its own card: A dashboard is a set of separate chart cards, not one flat image. Drag the churn chart next to the note about churn, or move one tile to the board for next week's meeting.
The numbers
A figure nobody can trace
Real values only: Storyflow tells ChatGPT to chart real values and never invented ones, and to leave a metric tile without a trend line when the file holds no history. You still check each tile against the file.
Money and percentages read as such: ChatGPT sends the format with the values, so revenue shows as dollars and churn as a percentage instead of bare numbers a reader has to decode.
A caption that states the finding: Each chart can carry one line under it that says what it shows, such as churn fell every month after March. It turns a picture into an answer the reader can agree or argue with.
The target on the chart: Ask for the target and it is drawn as a line across a bar or line chart, with its label. How are we doing against plan is then one look, not a second tile.
Next month
Starting from nothing every month
Change a chart by asking: Add a month, rename a series or flip the bars, and ChatGPT edits the chart that is there. It keeps its place and size on the board, so the layout you arranged survives.
A new type is a new chart: A bar chart cannot become a line chart in place. ChatGPT builds the line chart beside it, and you remove the old one yourself, because the connector has no delete tool.
No live link to the spreadsheet: Storyflow does not connect to Google Sheets, Excel or a database, and a chart does not refresh on its own. Upload the new file each month and ask ChatGPT to update the tiles.
Last month stays to compare: Ask for a fresh dashboard and it lands beside the old one, not over it. Keep both for a month and the board shows this month against last without any extra work.
Explore templates for your project
Every template opens as a real, editable board on the infinite canvas. Pick the closest fit and make it your own.
Mind Map
Branch one central idea out into themes and sub-points, then drag the connections around until the structure makes sense.
One app instead of five
Where Storyflow fits in a dashboard made with ChatGPT.
It holds the dashboard beside the plan. It does not replace your spreadsheet, refresh on its own or sort the rows.
Storyflow with ChatGPT
Recommended
Charts built from the real file
Dashboard beside the plan and notes on one canvas
Team opens it without ChatGPT
Change one chart by asking
Says who changed the board and when
Refreshes when the numbers change
Formulas and pivot tables
Sort and filter the rows
ChatGPT on its own
Charts built from the real file
Dashboard beside the plan and notes on one canvas
Team opens it without ChatGPT
Change one chart by asking
Says who changed the board and when
Refreshes when the numbers change
Formulas and pivot tables
Sort and filter the rows
Charts in the spreadsheet
Charts built from the real file
Dashboard beside the plan and notes on one canvas
Team opens it without ChatGPT
Change one chart by asking
Says who changed the board and when
Refreshes when the numbers change
Formulas and pivot tables
Sort and filter the rows
What creators are saying
Join early creators getting structured workspaces and AI that remembers their projects
“Storyflow has sped up my workflow by at least 3x, which means more flow state and more projects I can actually ship. It truly changed the way me and my team create.”

Reilin Joey
Director & YouTuber
“One prompt gets me a structured board. But the tactics are my favorite. I run my YouTube scripts through them and my intros and retention got better. It's amazing.”

Justkay
YouTuber & Freelance Filmmaker
“I used to juggle five apps to plan a project. Now I describe what I am making and get boards, lists, and a schedule. All in one place.”

George
@fernwehchronicles
Dashboards with ChatGPT: questions
What founders ask before they hand ChatGPT the month's numbers.
In Storyflow, yes, and it lands on a board instead of in the chat. Connect ChatGPT to Storyflow, upload the CSV or Excel file to a board, and ask for a dashboard. ChatGPT reads the file and builds a grid of tiles: metric tiles on top, then bar, line and pie charts, drawn from the real values and placed beside the file.
Storyflow is built for this job: ChatGPT reads the spreadsheet on your board and builds metric tiles and charts next to it, on the same canvas as the plan and the notes, where your team, investors or client open it without ChatGPT. Google Sheets or Excel still holds the live numbers and the formulas, and a BI tool such as Power BI or Tableau still does dashboards that refresh on their own.
Three layers. On top, three or four single numbers with the change since last month: revenue, customers, churn and runway are the usual four. Under them, one or two trends over twelve months. At the bottom, one breakdown, such as revenue by plan. In Storyflow that is seven tiles, and ChatGPT builds them in one request from a file with a row per month.
PDF, Word (.docx), Excel (.xlsx and .xls), CSV and plain text files that sit on the Storyflow board, up to 25 MB each. Long files come back cut short, and ChatGPT is told when that happens, so a sheet of monthly totals works better than a raw export of every transaction. Older .doc files and archives cannot be read.
You can, with one difference. A file attached in the chat stays in ChatGPT and is not copied into Storyflow. ChatGPT can read the numbers there and still build the tiles on your board. Upload the file to the Storyflow board as well if you want readers to open the source next to the charts.
A single chart is a bar, line or pie chart. A dashboard in Storyflow can also hold metric tiles with a headline number, gauges, radar charts and scatter charts, up to 16 tiles in rows of one to four. Bars can be stacked or horizontal, and a bar or line chart can carry a target line. Each chart is a separate card on the board.
No. Storyflow does not connect to Google Sheets, Excel or a database, so a chart shows the values it was built with until someone changes them. Upload the new month's file and ask ChatGPT to update each chart, or to build a new dashboard beside the old one. For numbers that must refresh by the hour, keep a BI tool.
Yes. Ask for a new title, another month of data or horizontal bars, and ChatGPT edits the chart that is on the Storyflow board and keeps its place. It cannot change a chart's type, and it has no delete tool. For a different type it builds a new chart beside the old one, and you remove the old one by hand.
Check them. Storyflow tells ChatGPT to use real values from the file and never to invent a number or a tile, but ChatGPT still reads and copies the figures itself, and a model can misread a column. The file sits beside the dashboard on the board, so comparing the four metric tiles with the last row takes a minute.
In ChatGPT on the web, open Settings, then Security and login, and turn on Developer mode. Go to chatgpt.com/plugins and click the plus button. Name it Storyflow, choose Public endpoint, paste https://mcp.storyflow.so/mcp and create it, then sign in. ChatGPT needs Plus, Pro, Business, Enterprise or Edu, on the web; on Business and Enterprise an admin turns on developer mode.
No. ChatGPT runs on its own model, so what it builds over the connector uses no Storyflow AI credits. A free Storyflow account (today, one invited by a paid member) gets 50 actions a week from its assistant, and every read and every change counts as one. The count resets every Monday (UTC). Plus, Pro and Max have no limit.
Yes. Storyflow's MCP server is one address, https://mcp.storyflow.so/mcp. Claude's Free plan allows one custom connector. Gemini's custom apps need a personal Google account with Keep Activity on, in the US, for people 18 or over, in English. On Grok Business and Enterprise, a team admin adds it in the xAI console first. Each one reads the same file and builds the same tiles.
No. Storyflow runs in the browser, with no native apps to install. ChatGPT connects to it from your ChatGPT account on the web with one address, and the people you share the dashboard with open the board in any browser.
More from Storyflow
Storyflow MCP server
Connect ChatGPT to Storyflow
Investor update template
Client report template
Client updates from ChatGPT
Project plan from a ChatGPT chat
Pitch deck with ChatGPT
Campaign wrap report
AI project memory
Launch roadmap
Product roadmap
Creative project management
Storyflow for startups
Storyflow for agencies
Project dashboard
Hand ChatGPT the spreadsheet. Hand the team the board.
Metric tiles, charts and the note that explains them, built in one conversation and kept beside the plan.