
Extremely clear strategy, zero busywork
Make the chart in ChatGPT,
and put it next to the plan it explains.
For founders and marketing teams: ChatGPT draws bar, line and pie charts from your real numbers on a Storyflow board, beside the plan, and updates them when the numbers move.


Creatives working for these brands already got early access
- Red Bull
- Canon
- Artlist
- Porsche
See how easy it is to get started
Watch a real project come together, from a blank board to a finished plan, clicked through step by step.
Start from a ready-made template
Pick a board to see what you can build, then let AI fill it in. Every template is a real, editable starting point on the same infinite canvas.

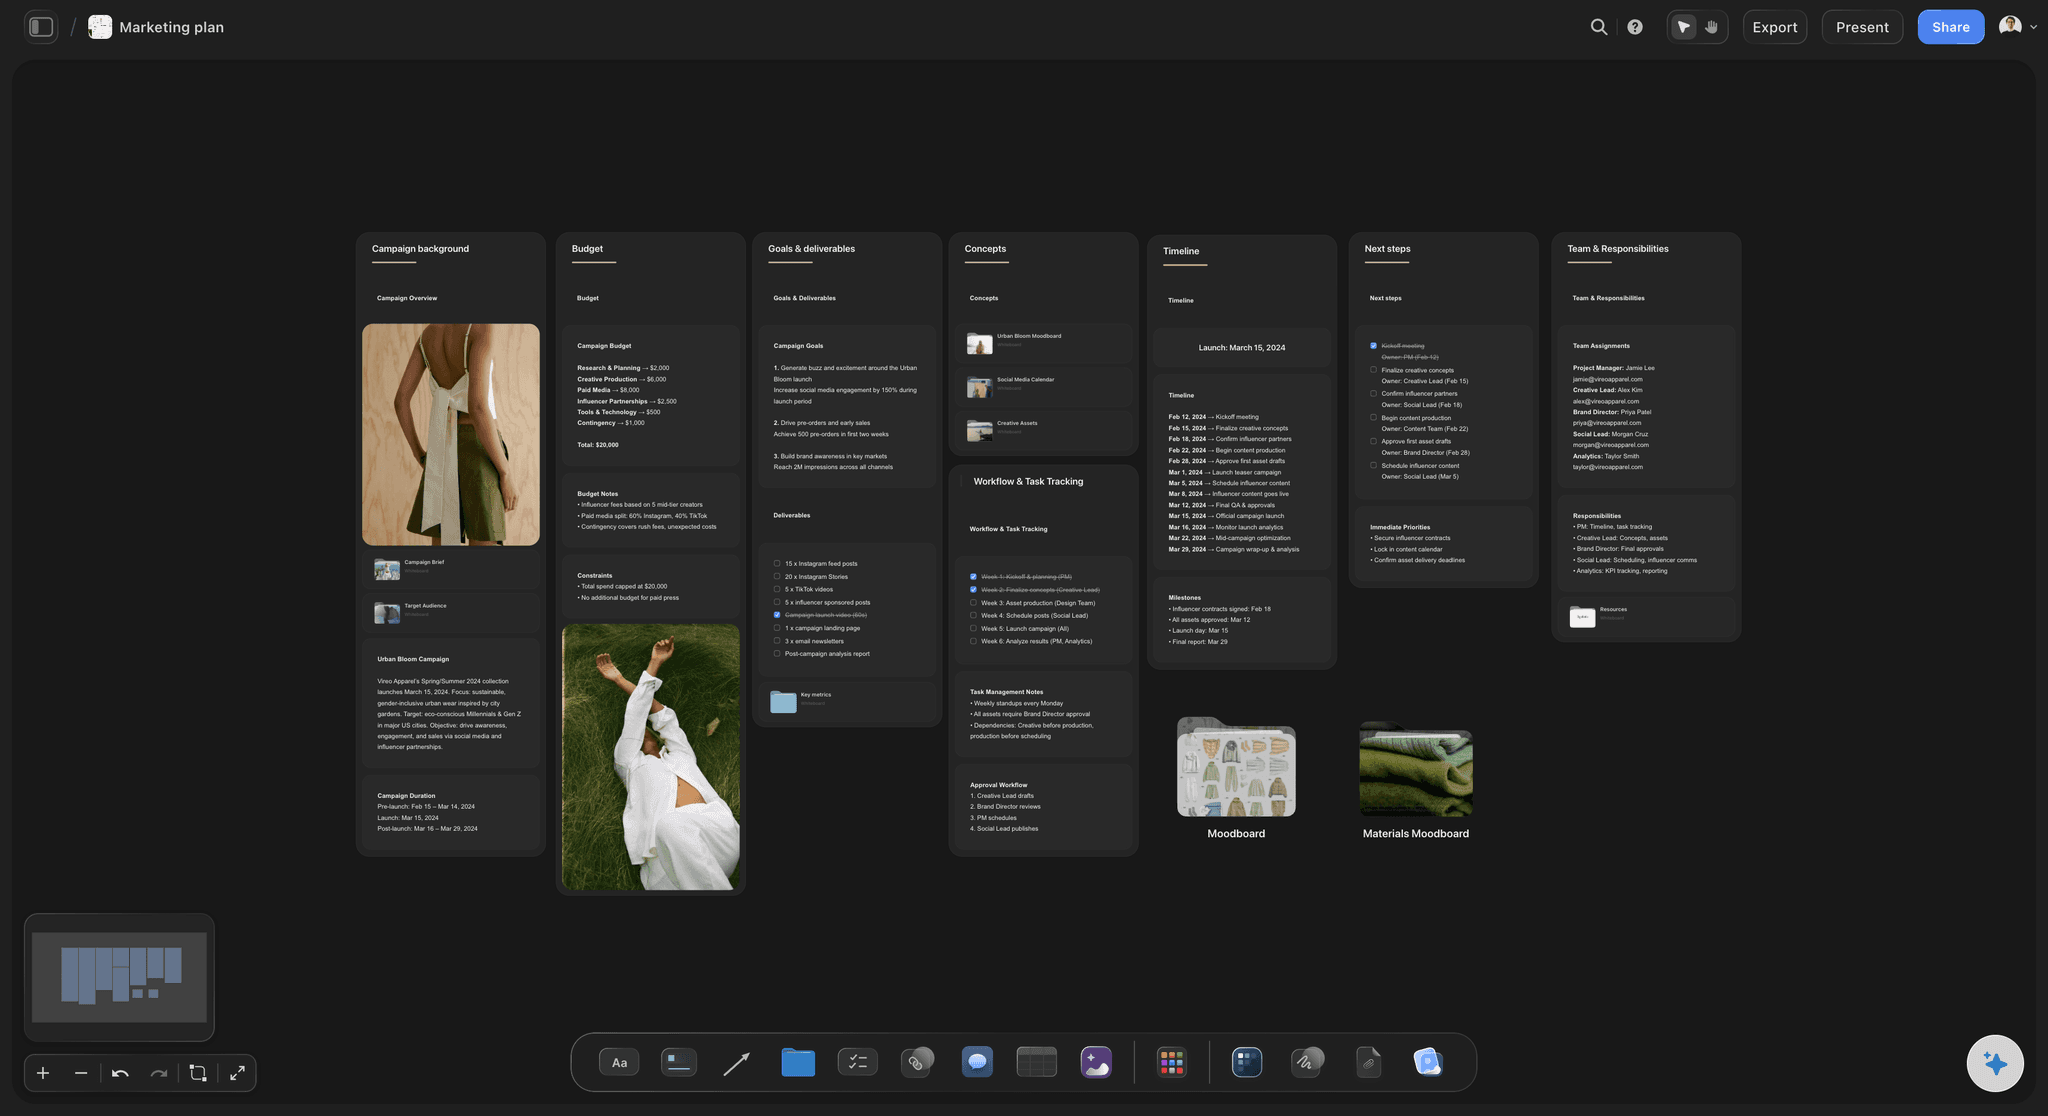
Marketing Plan
Lay out your goals, channels, and initiatives for the quarter on one board.
Can ChatGPT make a chart?
Yes, ChatGPT can make a chart: with the Storyflow plugin it draws bar, line and pie charts from your real numbers on a Storyflow board, next to the plan they are about, instead of leaving the result in one conversation. Storyflow is an AI visual workspace that puts charts on one infinite canvas next to the plan they explain: the launch timeline beside the signups line, the channel plan beside the leads bars, the budget table beside the budget pie. ChatGPT draws them on its own model, so the charts use none of your Storyflow AI credits.
ChatGPT is good at the analysis with nothing connected. Paste eight weeks of signups and it works out the trend, spots the dip in week 4 and tells you a line answers the question better than bars. The trouble is where the result ends up: in one person's chat. To show the team, someone copies it into a document or a slide, and does that again every time the numbers change, until the deck in Friday's meeting shows last month's chart.
With the plugin, ChatGPT takes the numbers from where they already are: a table on the board, a CSV or Excel file on it, or figures you paste into the chat. Then it draws a native chart on the board: a bar chart (upright, sideways, stacked or 100% stacked), a line chart or a pie, with a title, a one-line subtitle that says what it plots and a caption under it that says what it shows. It can draw a target line across a bar or line chart, print the value on each bar, put up to four headline figures across the top, and write money as money and percentages as percentages. When the numbers move, ChatGPT changes the chart that is there instead of drawing a new one, so it keeps its place beside the plan. For an overview of many measures at once, ask for a dashboard of tiles instead.
An example, with a made-up company. Brightloom, a six-person skincare brand, plans a spring launch on its marketing plan board. The marketing lead asks ChatGPT for three charts, one per question. First, a line chart of weekly email signups for the eight weeks before launch, against a target line at 500 a week: 180, 240, 310, 290, 420, 510, 560 and 640, captioned "Cleared the target in week 6". Second, a sideways bar chart of leads by channel with the value on each bar: Instagram 1,180, TikTok 820, email 640, partners 300 and paid search 160, which is 3,100. Third, a pie of the $20,000 launch budget: paid social 45%, creators 25%, content 20%, tools 5% and a 5% reserve. Each chart sits beside the part of the plan it explains. In week 9 she pastes the new figure, 705, and asks ChatGPT to add it: the line grows by one point and the chart stays where it was.
Most charts fail for one of four reasons, and each has a fix. The chart answers no question: write the question as the title and the answer as the caption. The type is wrong: bars compare things, lines show change over time, and a pie only works for parts of one whole, with about five slices or fewer. The target lives in a sentence somewhere else: draw it on the chart as a line. The labels are sentences: keep each category to two or three words and let the title carry the context. Ask ChatGPT for all four in the request, and check the axis. A log scale belongs only on values that span orders of magnitude, such as a funnel from 400 visits to 2 sales, and the caption should say when one is used.
The limits. A chart in Storyflow holds its own copy of the numbers: there is no live link to the table, the file or your spreadsheet, so new numbers go in by asking. There is no grid on the chart for typing numbers by hand. Through the plugin, ChatGPT cannot turn a bar chart into a line chart, though you can switch it yourself from the chart's menu on the board. ChatGPT has no tool that deletes a chart, so a chart you ask for twice appears twice. A picture you attach in the ChatGPT chat does not reach Storyflow. Storyflow does not embed charts on websites or pull from live data sources.
Ultra fast from brief to board
Four steps from a table of numbers to a chart beside the plan.
Getting the numbers onto the board is the slow part. The chart takes one message, and next week's update takes one more.
01
Install Storyflow from the plugin directory
Open the Storyflow listing in ChatGPT's plugin directory and select Install plugin. Sign in to Storyflow when asked, then choose which projects ChatGPT may use.
02
Put the numbers on the board
Add a table to the plan's board, or upload the CSV or Excel file to it. Weekly or monthly totals work best. For a quick chart, you can also paste the figures into the chat.
03
Ask for one chart per question
Name the board, the numbers and the question. For example: "Read the signups table on the Spring launch board and draw a line chart of weekly signups with a target line at 500. Caption it with what the line shows." The chart appears on the board.
04
Place it, check it, update it
Move the chart next to the part of the plan it explains, by dragging it or by asking ChatGPT. Check each value against the table. When new numbers arrive, ask ChatGPT to add them to the same chart.

The numbers, the chart and the plan, on one board.
ChatGPT draws the chart. Storyflow keeps it beside the decision it explains, where the whole team sees the same version.
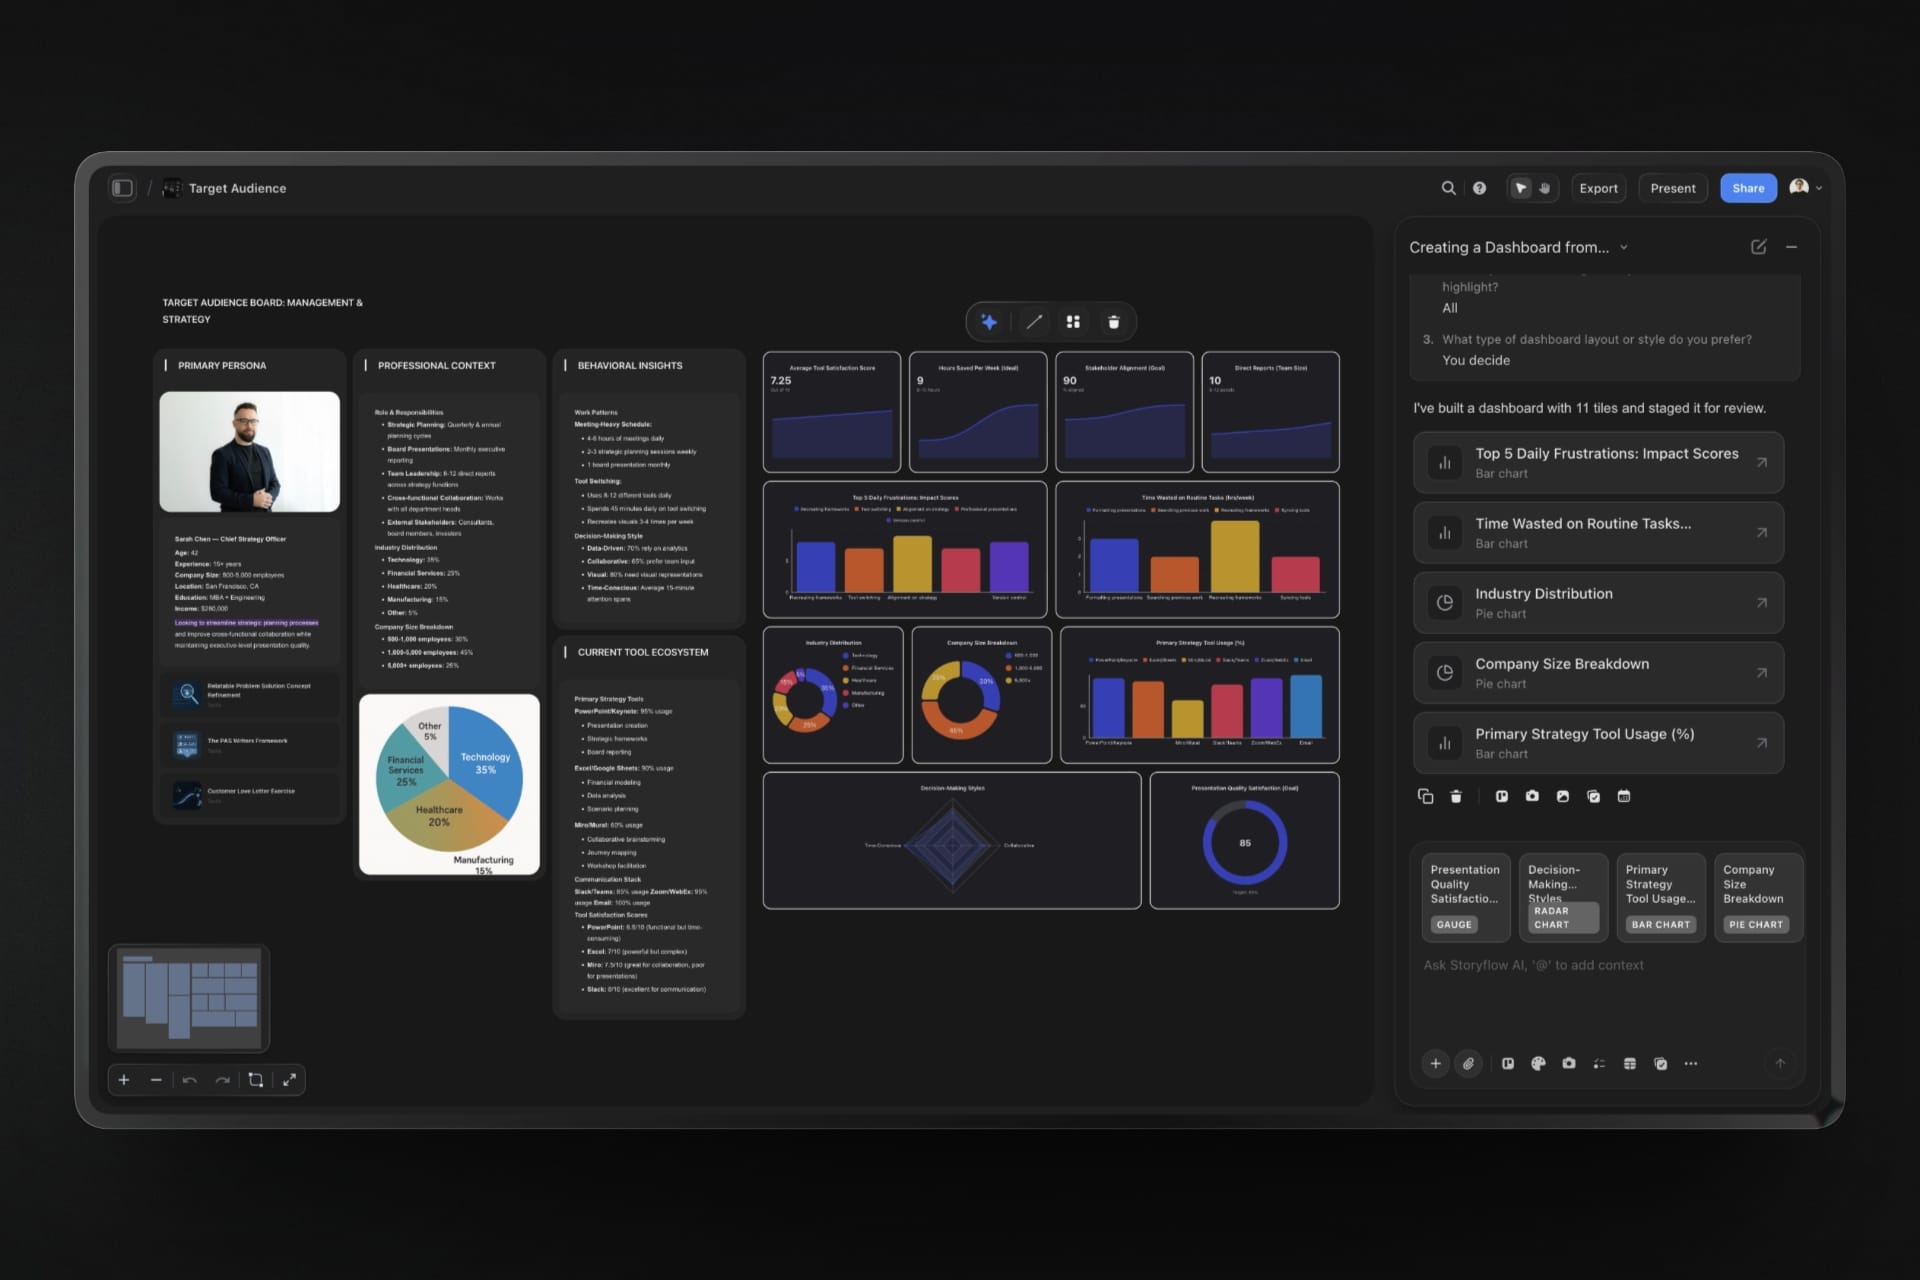
On the board
Native charts, not pasted pictures
Bar, line and pie charts drawn by the board itself, with a title, a caption and values you can hover over. A dashboard of many tiles is one request away when the question is "how are we doing".
See the dashboard with ChatGPT →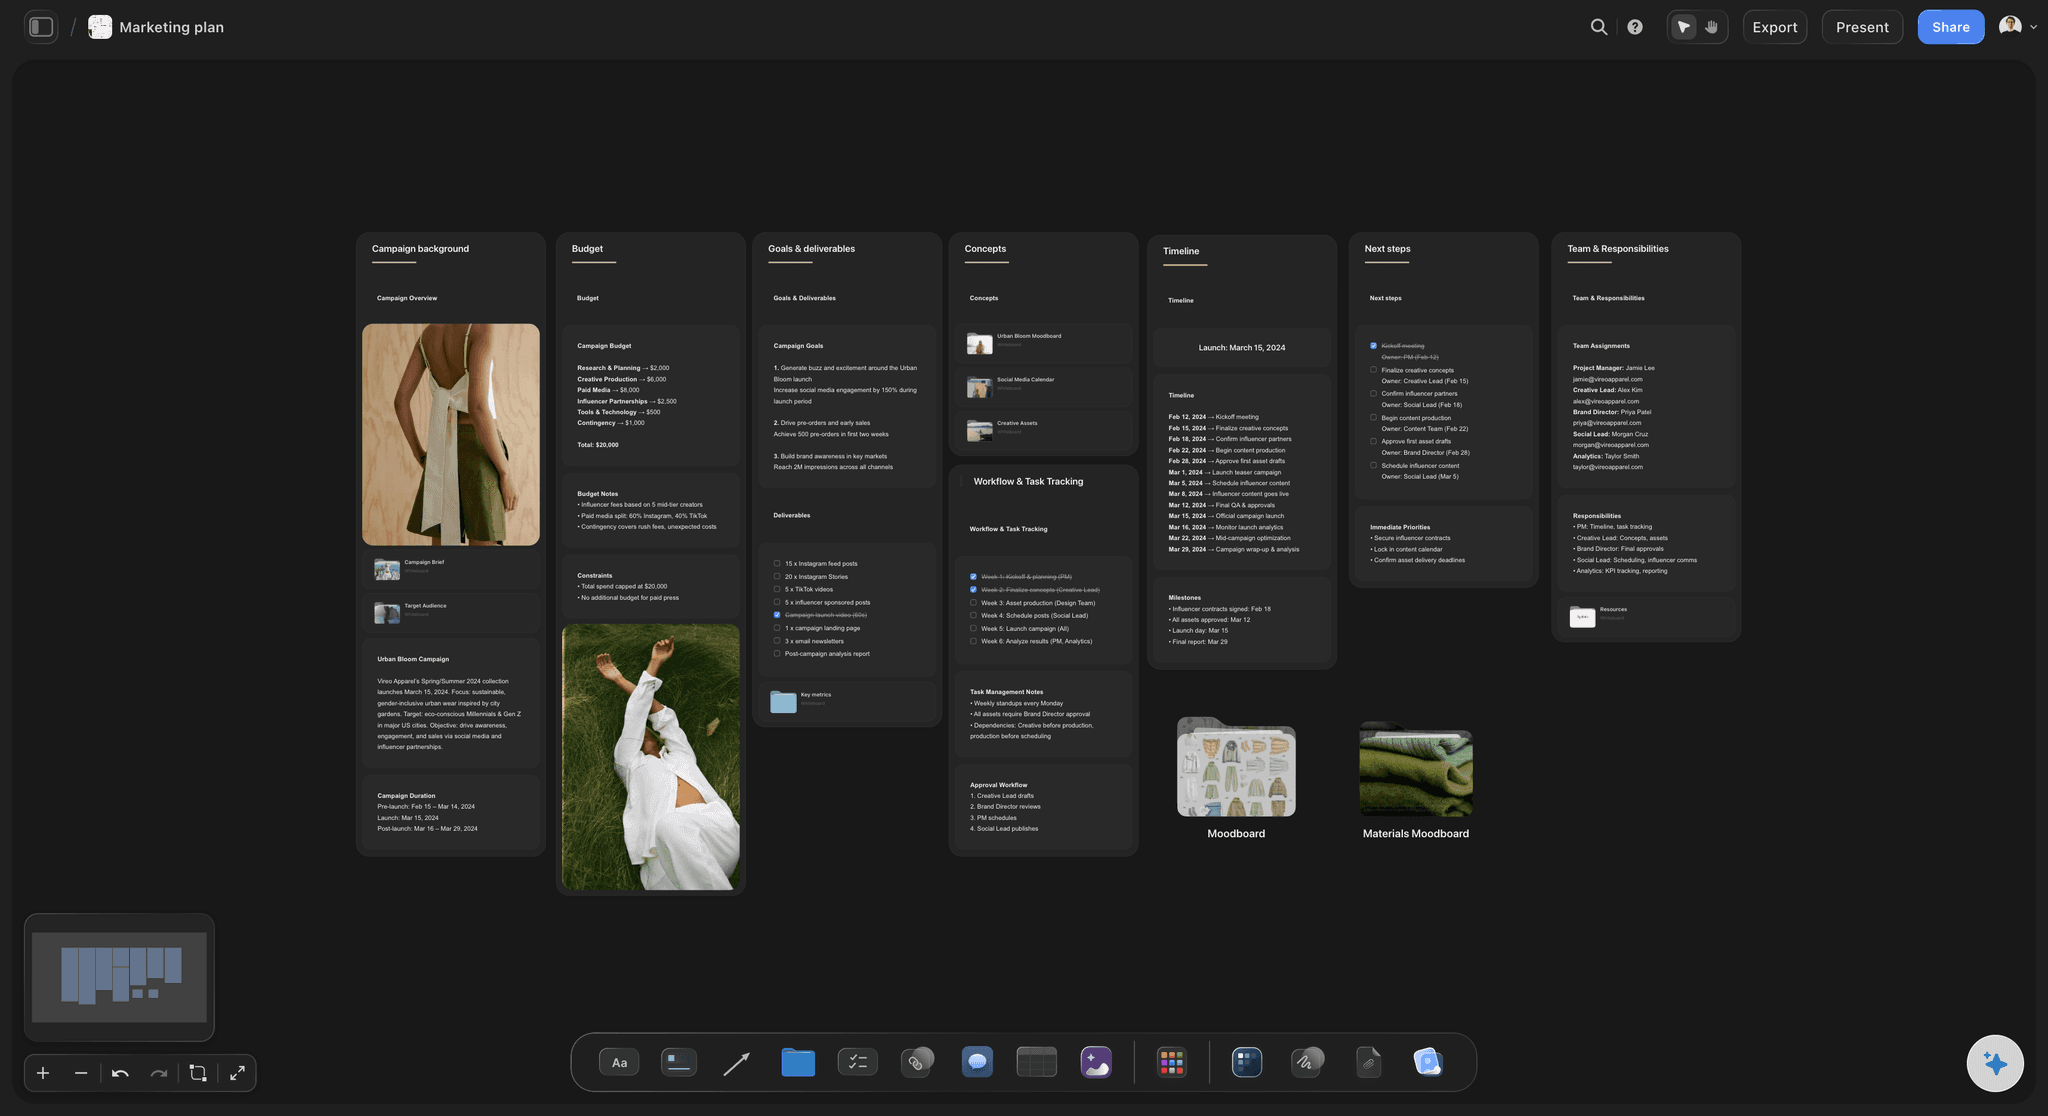
Beside the plan
Each chart next to the part it explains
The signups line beside the timeline, the budget pie beside the budget column. Someone reading the plan sees the evidence without opening another file.
See the marketing plan with ChatGPT →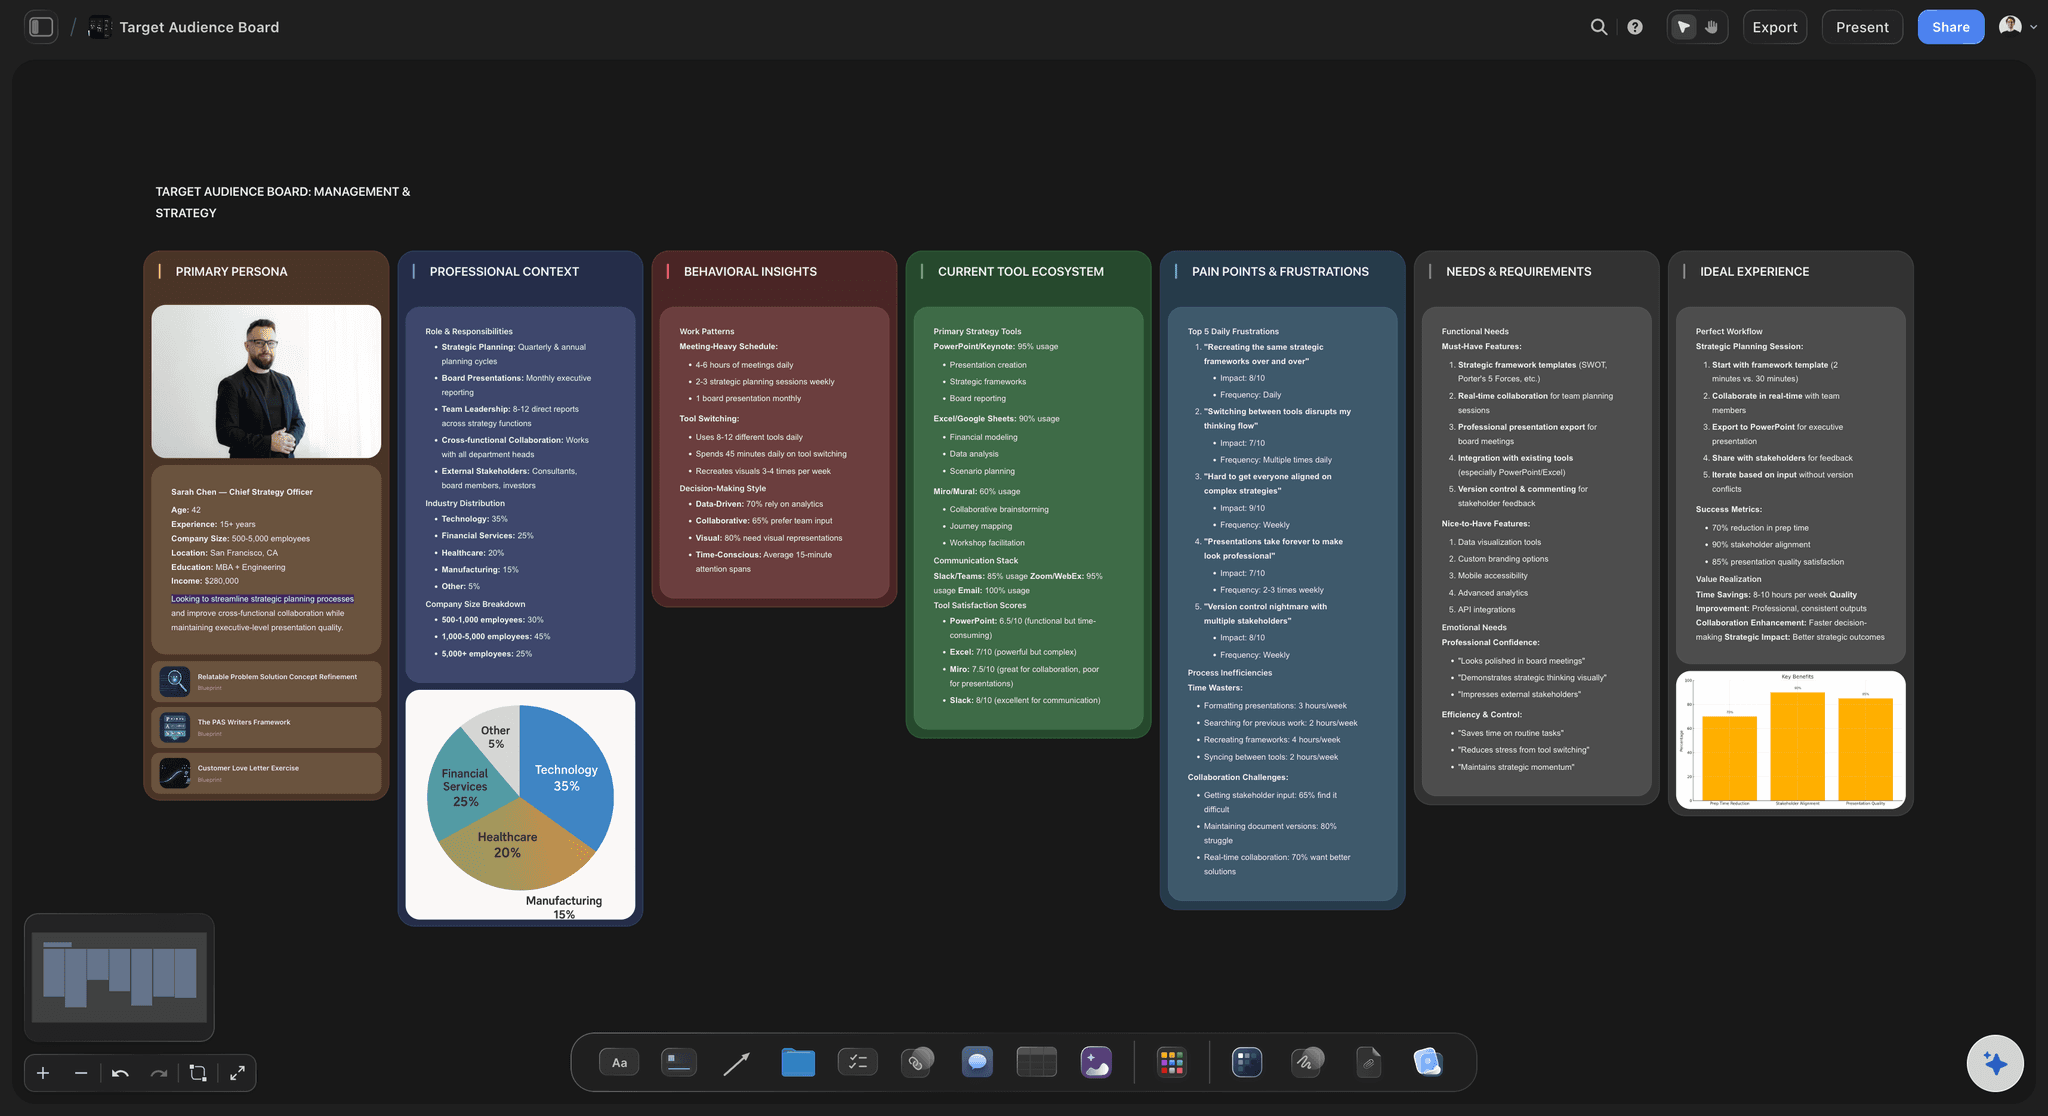
Beside the research
Charts that sit with the findings
A pie of who answered the survey next to the persona it describes, a bar chart of complaints next to the interview notes. ChatGPT can draw both from the same board it researched.
See the research board with ChatGPT →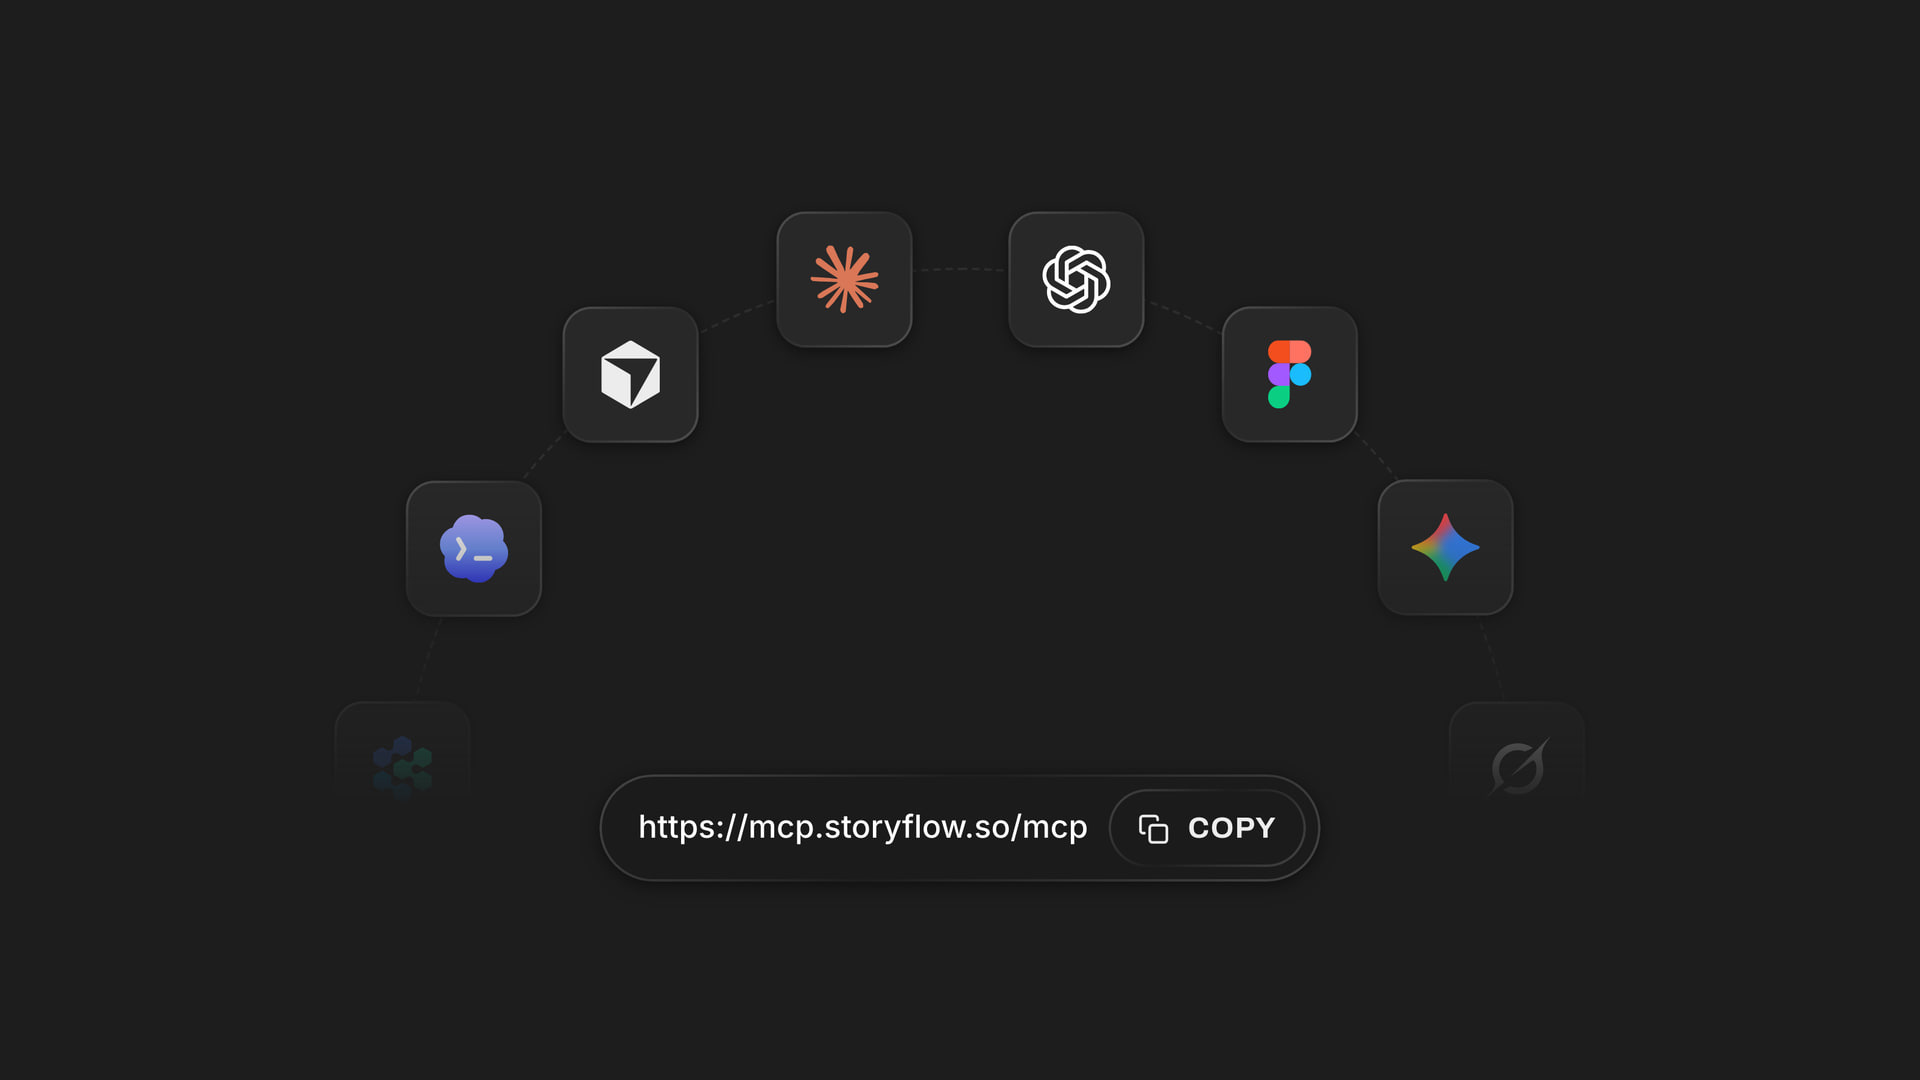
Any assistant
The same chart from ChatGPT or Claude
Storyflow connects to ChatGPT through the plugin, and to Claude, Gemini and Grok through one connector address. A co-founder on Claude can update the chart you drew in ChatGPT.
See how to connect your assistant →ChatGPT draws the charts. Your Storyflow credits stay untouched.
ChatGPT runs on its own model, so a chart it draws through the plugin uses no Storyflow AI credits. An invited free Storyflow account can make 25 plugin actions a week, reset every Monday (UTC), and Plus, Pro and Max have no weekly limit. Storyflow is paid-only during early access, from $7.99 a month billed annually ($9.99 monthly), and anyone a paid member invites to a board joins free.
No Storyflow AI credits spent on charts ChatGPT draws
No weekly limit on plugin actions on Plus, Pro and Max
Save any chart as a PNG picture
Teammates you invite to the board join free
You choose which projects ChatGPT may open, and whether it may change them
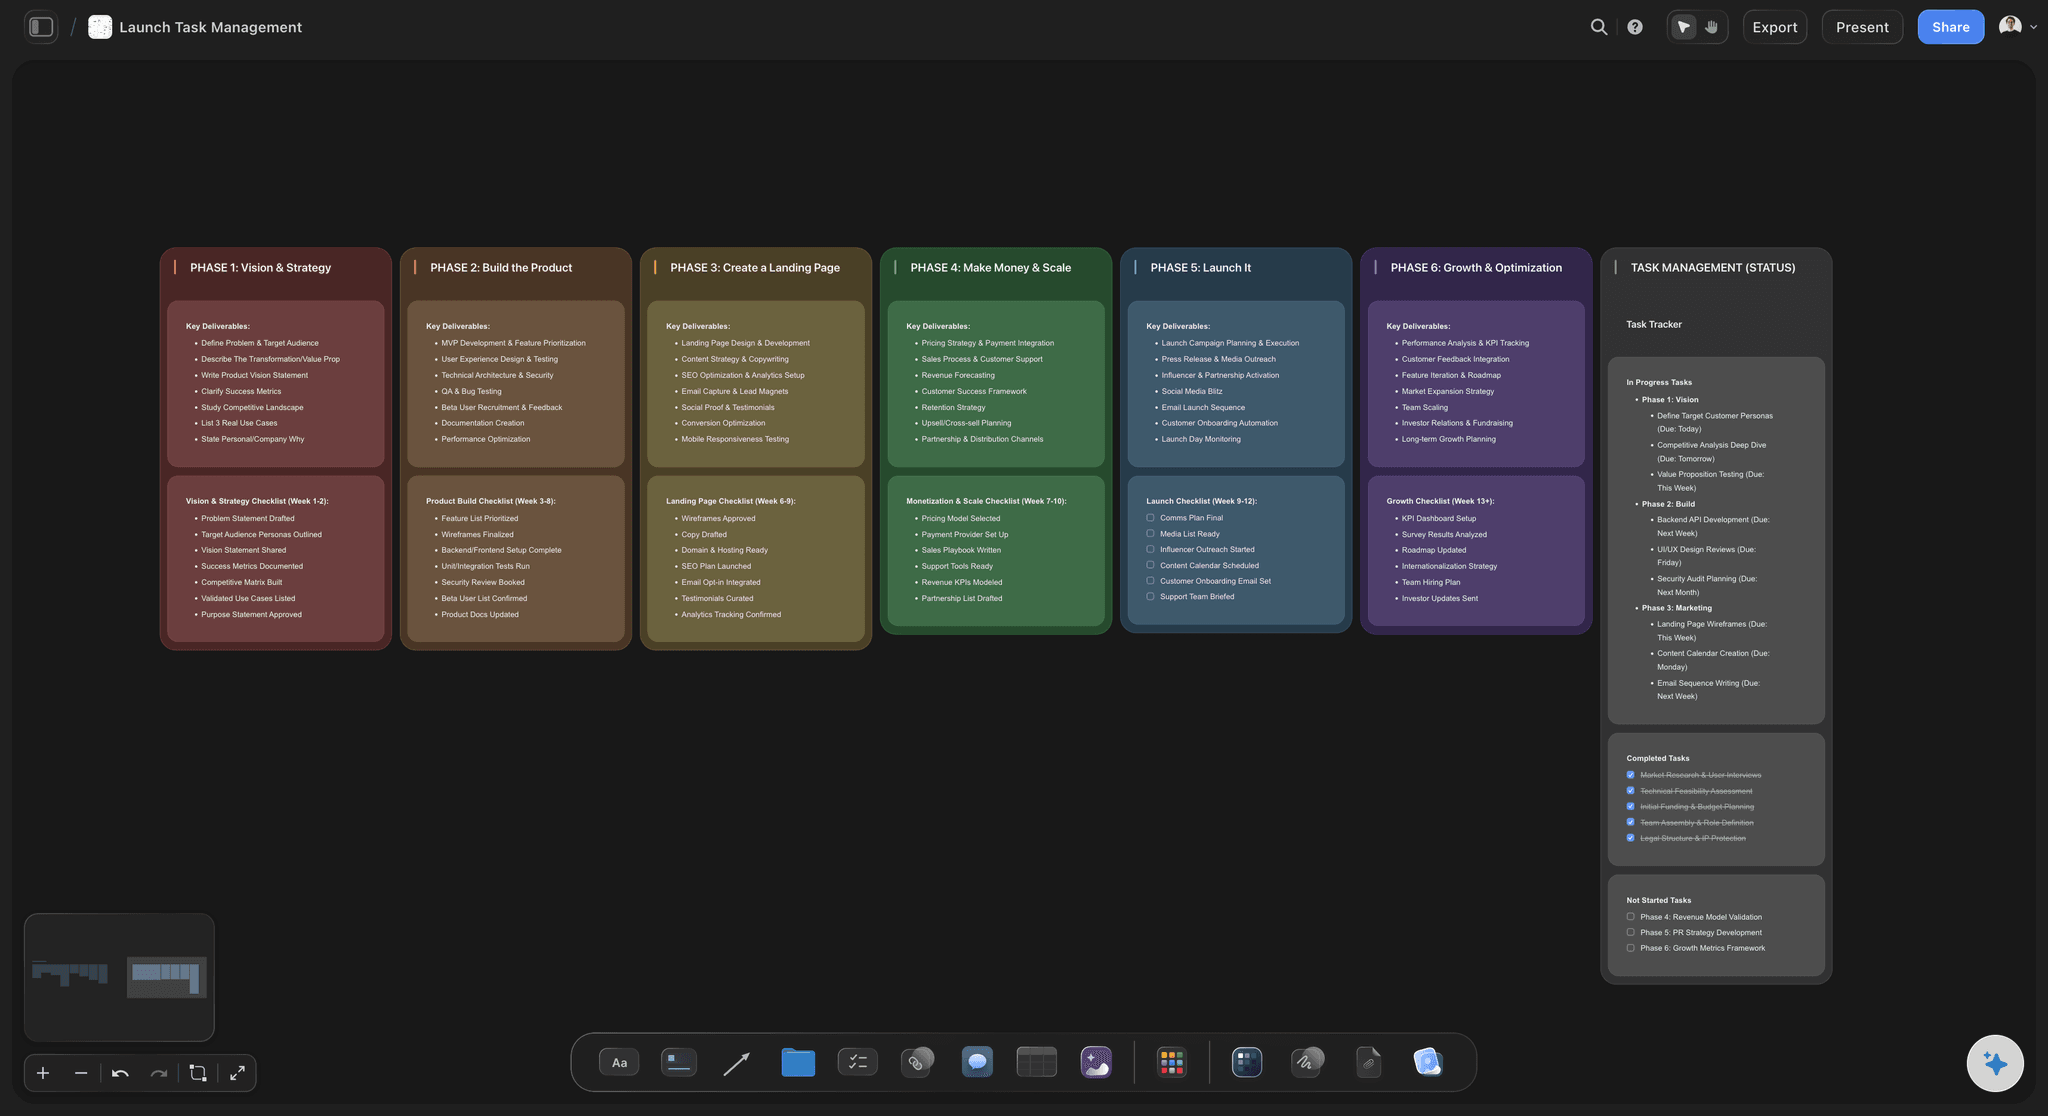
Built for people with taste
Where a chart made in a chat goes stale.
ChatGPT reads numbers well. Without a board, what it makes lives in one chat, and every update means another copy and another paste.
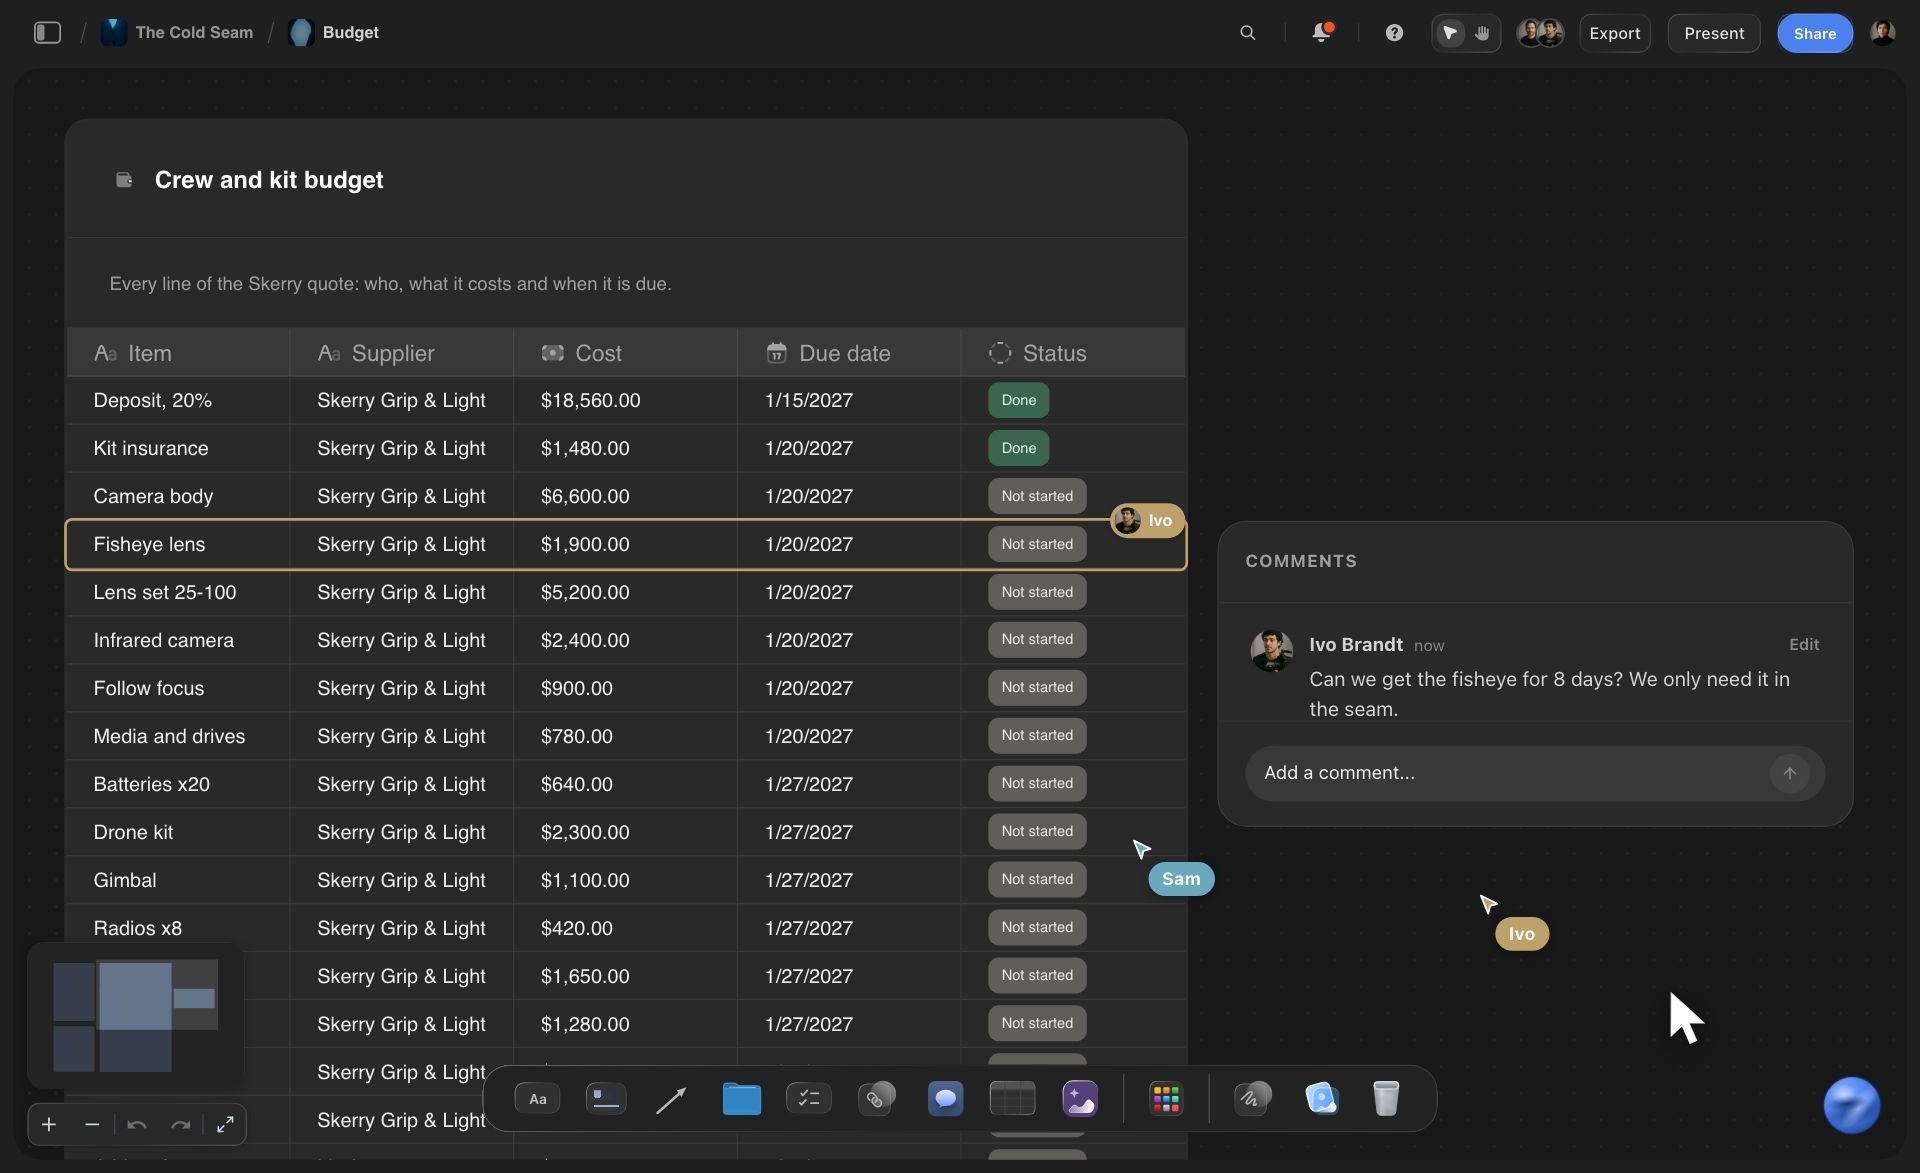
The numbers
A chart is only as true as its numbers
From the table on the board: ChatGPT reads the table the plan already uses, so the chart and the plan show the same figures.
From a file on the board: A CSV or Excel file on the board is read there, up to 25 MB and the first 40,000 characters. Give it the summary sheet, not a raw export of every order.
Real values only: The chart tool tells ChatGPT to use real values and never to invent a series. A metric tile with no history shows the number on its own, not a made-up trend.
Ask what changed: Before the review, ask ChatGPT what changed on the board this week and who changed it, so the chart picks up the corrected numbers.
The reading
A chart nobody understands in five seconds
The question above, the answer below: A one-line subtitle says what the chart plots. A caption under it says what it shows, in about 90 characters, such as "Cleared the target in week 6".
The target on the chart: A line across the chart at the target, with its label, answers "are we on track" without a second chart.
Headline figures: Up to four big numbers across the top, such as the total or the conversion rate, so nobody works them out from the bars.
Money and percentages written properly: Values show as $20,000, 45% or 1.2K, in the currency you name, instead of bare numbers.
The update
Next month's numbers
Changed in place: "Add week 9: 705." ChatGPT changes the chart that is there, keeping its place, its size and the board's undo history.
Switched by hand: From the chart's menu on the board, switch between upright bars, sideways bars, a line and a pie where the data fits, or turn on values on bars and stacking.
Saved as a picture: Save any chart as a PNG from its menu for an email or a slide. Export the whole board as PNG, JPEG or PDF.
One link for the team: Share the board from Storyflow with a view-only link that opens with no account. Everyone sees the same chart, updated, beside the same plan.
Explore templates for your project
Every template opens as a real, editable board on the infinite canvas. Pick the closest fit and make it your own.
Marketing Plan
Lay out your goals, channels, and initiatives for the quarter on one board.
One app instead of five
ChatGPT with a board, ChatGPT alone, or Flourish.
Storyflow keeps the chart beside the plan. Flourish, also in ChatGPT's plugin directory as of October 2026, builds interactive charts in your Flourish account that you can open, edit, share and embed (Flourish's connector page).
Storyflow with ChatGPT
Recommended
Works out what your numbers show
Chart sits beside the plan it explains
Reads the table or file on your Storyflow board
Interactive chart the team opens without ChatGPT
Published or embedded on a website
ChatGPT on its own
Works out what your numbers show
Chart sits beside the plan it explains
Reads the table or file on your Storyflow board
Interactive chart the team opens without ChatGPT
Published or embedded on a website
Flourish
Works out what your numbers show
Chart sits beside the plan it explains
Reads the table or file on your Storyflow board
Interactive chart the team opens without ChatGPT
Published or embedded on a website
What creators are saying
Join early creators getting structured workspaces and AI that remembers their projects
“Storyflow has sped up my workflow by at least 3x, which means more flow state and more projects I can actually ship. It truly changed the way me and my team create.”

Reilin Joey
Director & YouTuber
“One prompt gets me a structured board. But the tactics are my favorite. I run my YouTube scripts through them and my intros and retention got better. It's amazing.”

Justkay
YouTuber & Freelance Filmmaker
“I used to juggle five apps to plan a project. Now I describe what I am making and get boards, lists, and a schedule. All in one place.”

George
@fernwehchronicles
Charts with ChatGPT: questions
What founders and marketing leads ask before a chart goes into the plan.
Yes. With the Storyflow plugin, ChatGPT draws bar, line and pie charts on your Storyflow board from a table or file on the board, or from figures you paste into the chat. Each chart gets a title and a caption, bars and lines can carry a target line, and the chart sits beside the plan it explains. When the numbers move, ChatGPT changes it in place.
Storyflow is our pick first for charts that belong in a plan, because ChatGPT draws them on the same board as the plan and the team sees them without opening ChatGPT. Storyflow is our product. Flourish, also in ChatGPT's plugin directory, is the better fit when the chart has to be published or embedded on a website.
Open the Storyflow listing in ChatGPT's plugin directory and select Install plugin. Sign in to Storyflow when asked, then choose which projects ChatGPT may use and whether it may make changes. In a chat, type @ and pick Storyflow, or choose it from the + menu. Availability depends on your ChatGPT plan, workspace and region.
Three kinds of single chart: bar charts, upright or sideways, plain, stacked or 100% stacked; line charts; and pie charts. Each takes a title, a one-line subtitle, a caption and up to four headline figures. Bars and lines can carry a target line, and bars can print their values. For gauges, radar or scatter charts and metric tiles, ask ChatGPT for a dashboard instead.
From a table on your Storyflow board, from a CSV or Excel file on the board, or from figures you paste into the chat. The chart tool tells ChatGPT to use real values only, so give it the numbers rather than asking it to estimate. Weekly or monthly totals read whole; a raw export of every order may be cut short.
Yes, if ChatGPT can read the values in the picture. The screenshot you attach in the ChatGPT chat does not reach Storyflow, but ChatGPT can take the numbers from it and draw a new chart on your board. Only the data, the labels, the chart type, the bar direction and the colours carry across, never the old chart's fonts or layout, so check every value against the original.
Yes, by asking. Tell ChatGPT the new figures, such as "add week 9: 705", and it changes the chart already on your Storyflow board, keeping its place and size. There is no live link to a spreadsheet, so next month you add the new numbers to the table on the board and ask again.
Partly. From the chart's menu on the board you can switch between upright bars, sideways bars, a line and a pie, turn on values on the bars or stacking, and save the chart as a PNG. There is no grid for typing numbers into the chart, so the numbers change when you ask ChatGPT.
Bars to compare things, such as leads by channel. A line for change over time, such as weekly signups. A pie only for parts of one whole, such as a budget split, with about five slices or fewer. If the point is how you are doing against a goal, add the goal as a target line instead of drawing a second chart.
Save a single chart as a PNG from its menu, or export the whole board as PNG, JPEG or PDF. To share it live, send a view-only link to the board from Storyflow: it opens in a browser with no account, and visitors sign in to comment. ChatGPT does not share boards or export files for you.
No credits. The plugin runs on ChatGPT's own model and your ChatGPT plan. An invited free Storyflow account can make 25 plugin actions a week, reset every Monday (UTC), and Plus, Pro and Max have no weekly limit. Storyflow is paid-only during early access: Plus is $7.99 a month billed annually, Pro $14 and Max $39.
Yes, if your admin allows it. In a Business or Enterprise workspace an admin manages plugins and can turn them on or off, so ask yours to make Storyflow available if it does not appear. Each person then installs it and signs in to their own Storyflow account.
The chart is the same; only the way in differs. ChatGPT installs Storyflow from its plugin directory. Claude, Gemini and Grok add https://mcp.storyflow.so/mcp as a custom connector, with steps for each at storyflow.so/mcp. All of them reach the same Storyflow account, so a co-founder on Claude can add next month's numbers to your chart.
Through the plugin, ChatGPT cannot change a chart's type, delete a chart, read board comments or generate pictures. A chart holds its own copy of the numbers, with no live link to a spreadsheet or data source, and Storyflow does not embed charts on websites. Every connection ends after 30 days, and then ChatGPT asks you to sign in again.
More from Storyflow
Connect ChatGPT to Storyflow
Storyflow MCP server for every assistant
Dashboard with ChatGPT, from a spreadsheet
Marketing plan with ChatGPT
Research board with ChatGPT
Team presentations with ChatGPT
One-pager with ChatGPT
Diagrams with Claude
Project dashboard
Storyflow for marketing teams
Storyflow for startups
Best ChatGPT plugins for marketing teams
Best ChatGPT plugins for founders
Draw the chart where the plan already is.
Real numbers from the board, one chart per question, a caption that says what it shows, and an update that takes one message.