
An ultra-fast canvas that stays calm
Make flowcharts and diagrams with Claude
on a board you can still edit.
For founders: describe the flow to Claude and it draws the boxes and arrows on a Storyflow board, where you drag, rename and add to them like anything else you made.


Creatives working for these brands already got early access
- Red Bull
- Canon
- Artlist
- Porsche
See how easy it is to get started
Watch a real project come together, from a blank board to a finished plan, clicked through step by step.
Start from a ready-made template
Pick a board to see what you can build, then let AI fill it in. Every template is a real, editable starting point on the same infinite canvas.

Mind Map
Branch one central idea out into themes and sub-points, then drag the connections around until the structure makes sense.
Can Claude make flowcharts and diagrams?
Yes. Claude can turn a description of a process into a flowchart, a user journey, an org chart or a swimlane, usually as diagram code or a drawing in the chat, but that result is a picture: to move one box you ask Claude to draw the whole thing again. Storyflow is an AI visual workspace that makes flowcharts and diagrams on one infinite canvas: boxes on a neat grid, labelled arrows between them, and the notes, documents and plans they explain right beside them. Connected to Storyflow, Claude draws the diagram on your board as real boxes and arrows you can drag and edit, using its own model, so it costs you no Storyflow AI credits.
On its own, Claude is good at the thinking part of a diagram. Describe how a customer signs up and it finds the steps you skipped, asks what happens when the email bounces, and writes the flow as diagram code that it can show as a drawing. That drawing is the limit. You cannot drag a box, put a note next to step 3, or hand it to a teammate to change. Every edit is another prompt and another full redraw, and the diagram lives in the chat, away from the plan it was meant to explain.
Connect Claude to Storyflow and ask for the same diagram on a board. Claude decides which box goes in which column and row, and Storyflow does the rest: every box the same width, each column as wide as its widest box, and room bought for each arrow's label so no label lands on a box. It draws up to 40 boxes and up to 60 arrows in one go. A box can be a plain note, a task with a title and detail, a picture, a colour, a table, a document or a folder, so an index of your company's documents is a diagram too. Once it is drawn, you drag boxes, rename them, add arrows and change arrow labels like anything else on the board.
A worked example you can copy without signing up: a signup flow for a software product, laid out left to right. Row 1, columns 1 to 5: Visit pricing page, Start free trial, Verify email, Create first project, Invite a teammate. From Invite a teammate, two arrows: one labelled "by day 7" to Upgrade to paid in row 1, column 6, and one labelled "no invite" down to Day 10 reminder email in row 2, column 6. That is seven boxes and six arrows. Draw it before you build anything and the empty corners show themselves: what happens to someone who never verifies their email?
Four shapes cover most of what founders draw. A flowchart is a process that goes somewhere, with a box per step and an arrow per move. A user journey is the same, told from the customer's side, with what they feel at each step. An org chart runs top to bottom: one box for each person, joined to the person they report to. A swimlane puts each team on its own row, so you see where work passes from sales to onboarding to finance. For ideas that branch out from one centre rather than flow, Claude can also draw a mind map, a web of notes or a ring of things around one hub.
Some things Storyflow does not do. It has no UML, BPMN or network shape libraries, and it does not export a diagram as an SVG or Visio file; Lucidchart or draw.io still cover those. Decisions are boxes with labelled arrows, not diamond shapes. The same connector works with ChatGPT, Gemini and Grok, so a co-founder who prefers ChatGPT can add a box to the diagram Claude drew, and you can ask either one what changed on the board this week.
Ultra fast from brief to board
From a description to a diagram in four moves.
The first diagram takes about as long as describing the process out loud. The second one is quicker, because the board already holds the notes Claude reads from.
01
Connect Claude to Storyflow once
In Claude, open Customize, then Connectors, click Add, then Add custom connector. Name it Storyflow, paste https://mcp.storyflow.so/mcp, click Continue, choose Sign in now and click Add. Sign in to Storyflow and pick a project.
02
Describe the flow
Tell Claude what the process is and who is in it, in plain words. For example: "Draw our signup flow as a flowchart on the Product board, from the pricing page to the first paid month."
03
Read the diagram it draws
The boxes land on a grid below or beside what is already on the board, joined by arrows, with labels where a step is not obvious. Ask Claude what is missing, and it adds the boxes and arrows.
04
Edit it like anything else
Drag boxes, rename them, draw a new arrow or change a label by hand. Put the notes and documents the diagram explains right next to it, and share the board with your team, who can edit it too.
Flowcharts, journeys, org charts and swimlanes.
Claude decides what goes where. Storyflow lays it out and keeps it editable.
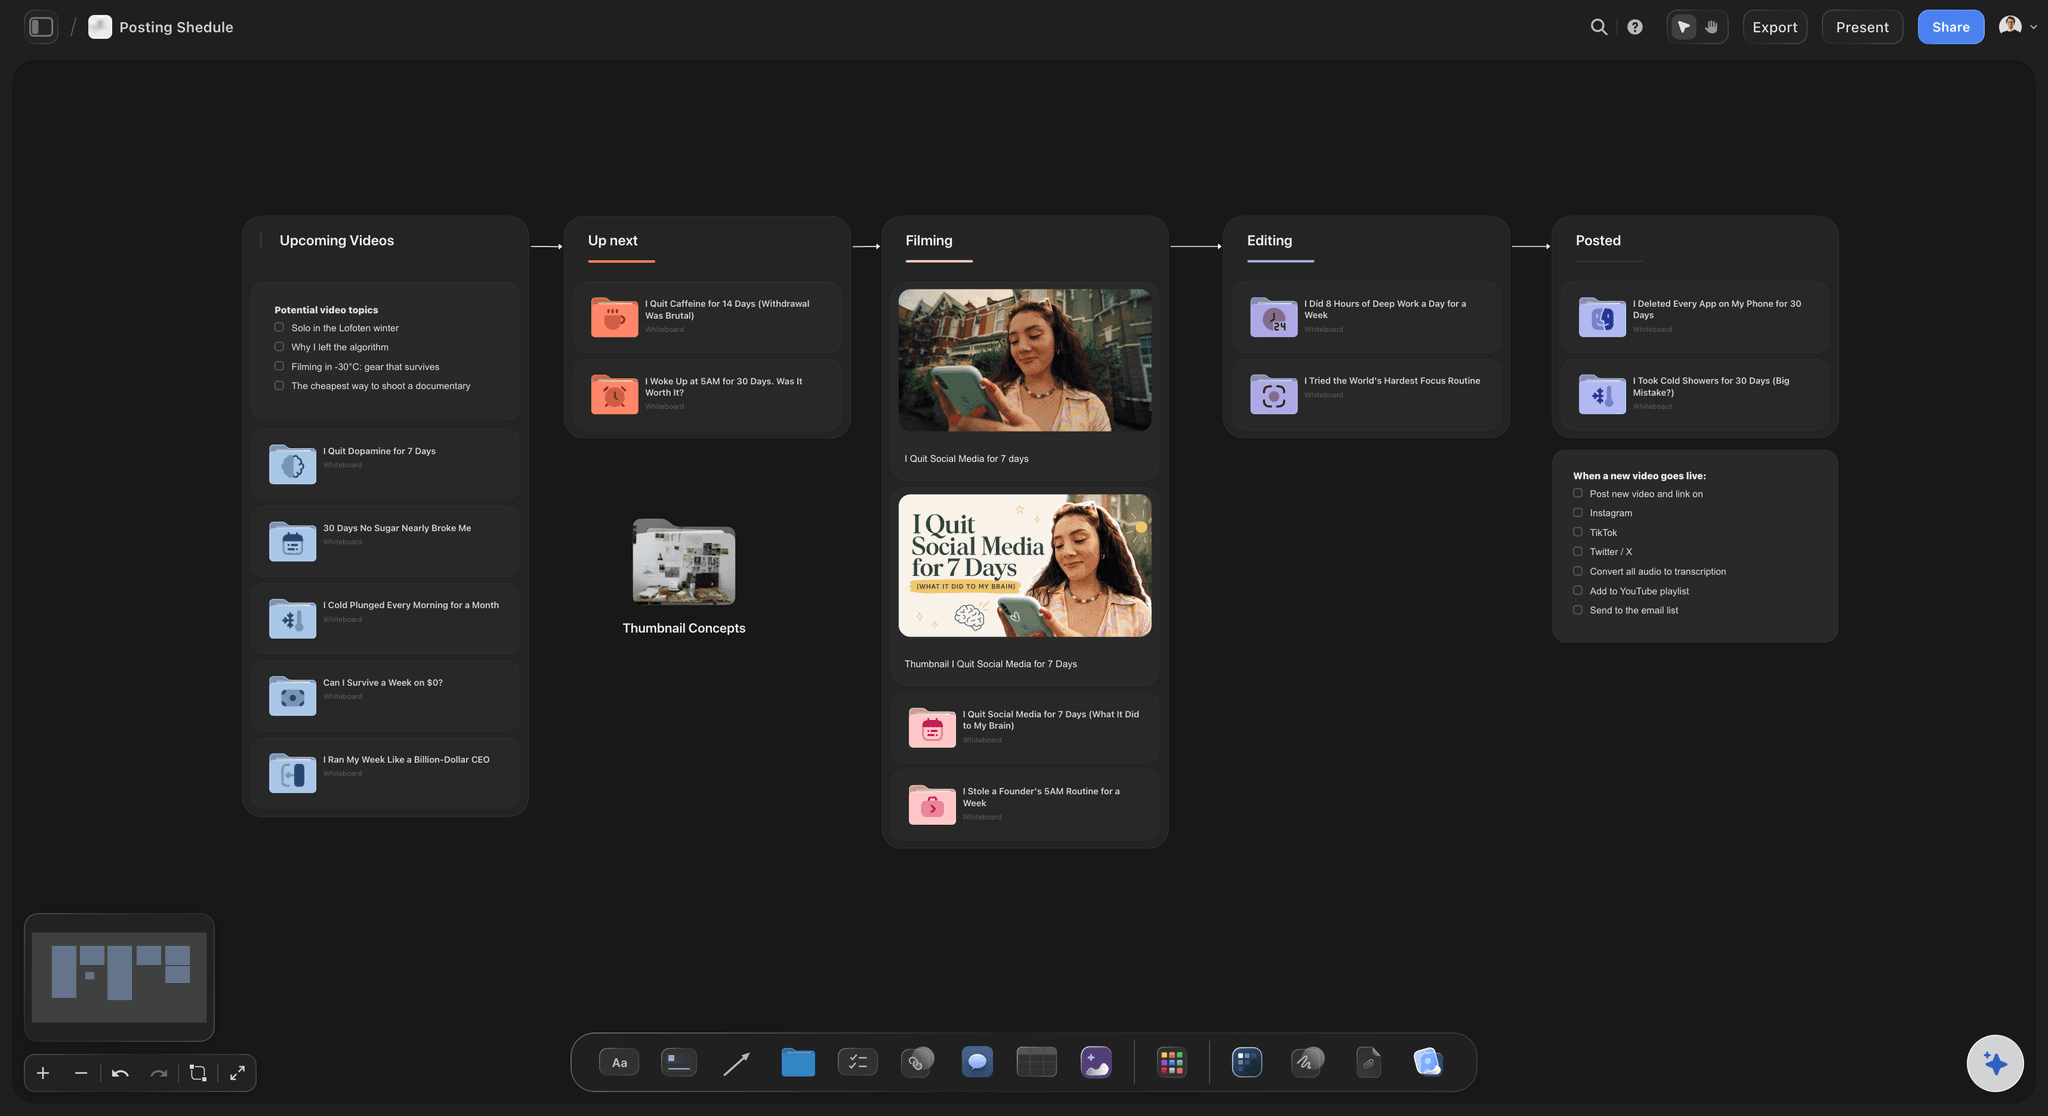
A flow that goes somewhere
Stages joined by arrows
Each stage is a box or a column, and arrows show which way the work moves. Put the detail inside each stage, so the diagram is also the place the work is planned. When the process changes, you move a box instead of drawing the chart again.
See the flowchart maker →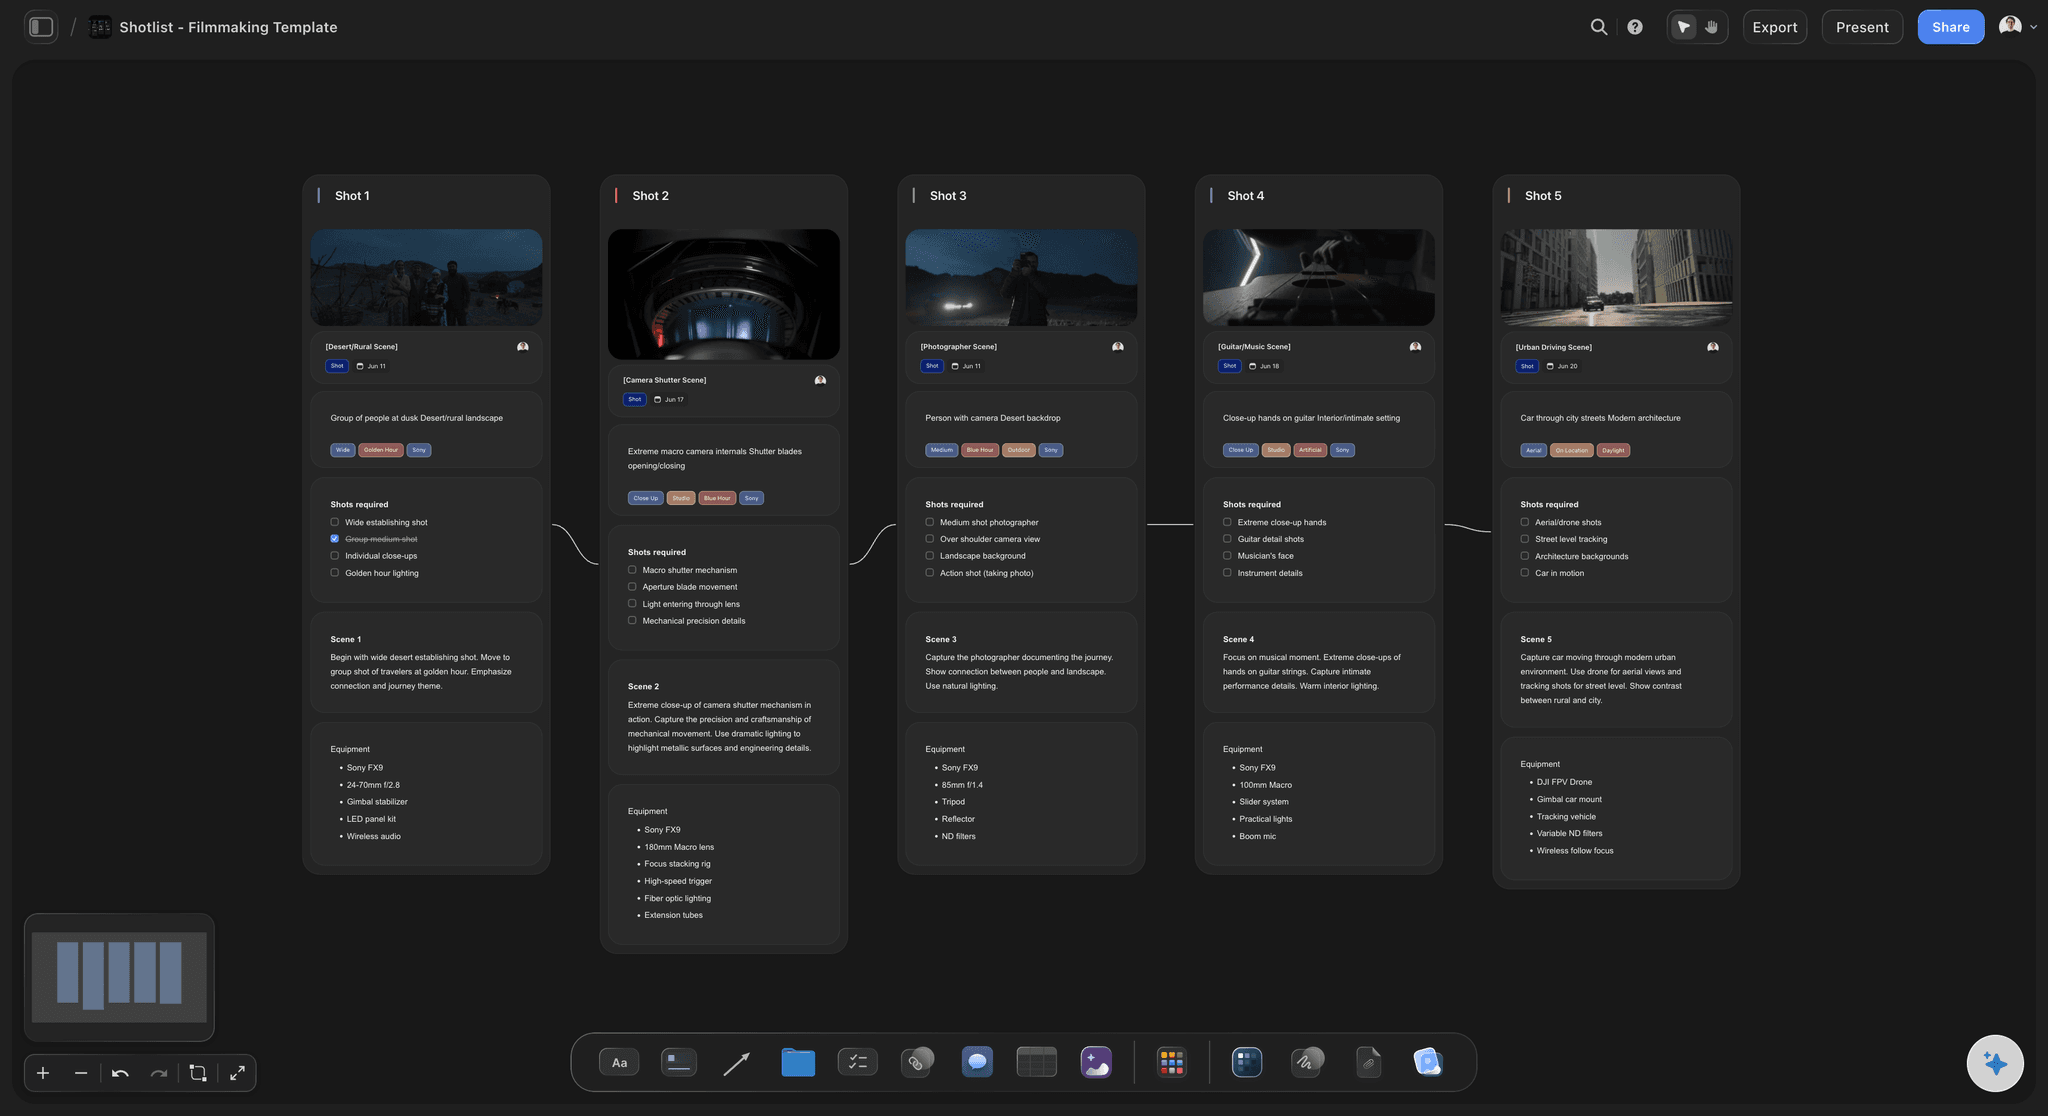
From the customer's side
User journeys you can change
Ask Claude to draw the journey from first visit to paying customer, with a labelled arrow for each move. When you find a gap, add the missing step by hand or ask Claude to add it. Put the customer quotes that explain each step in a note beside it.
See the user journey map →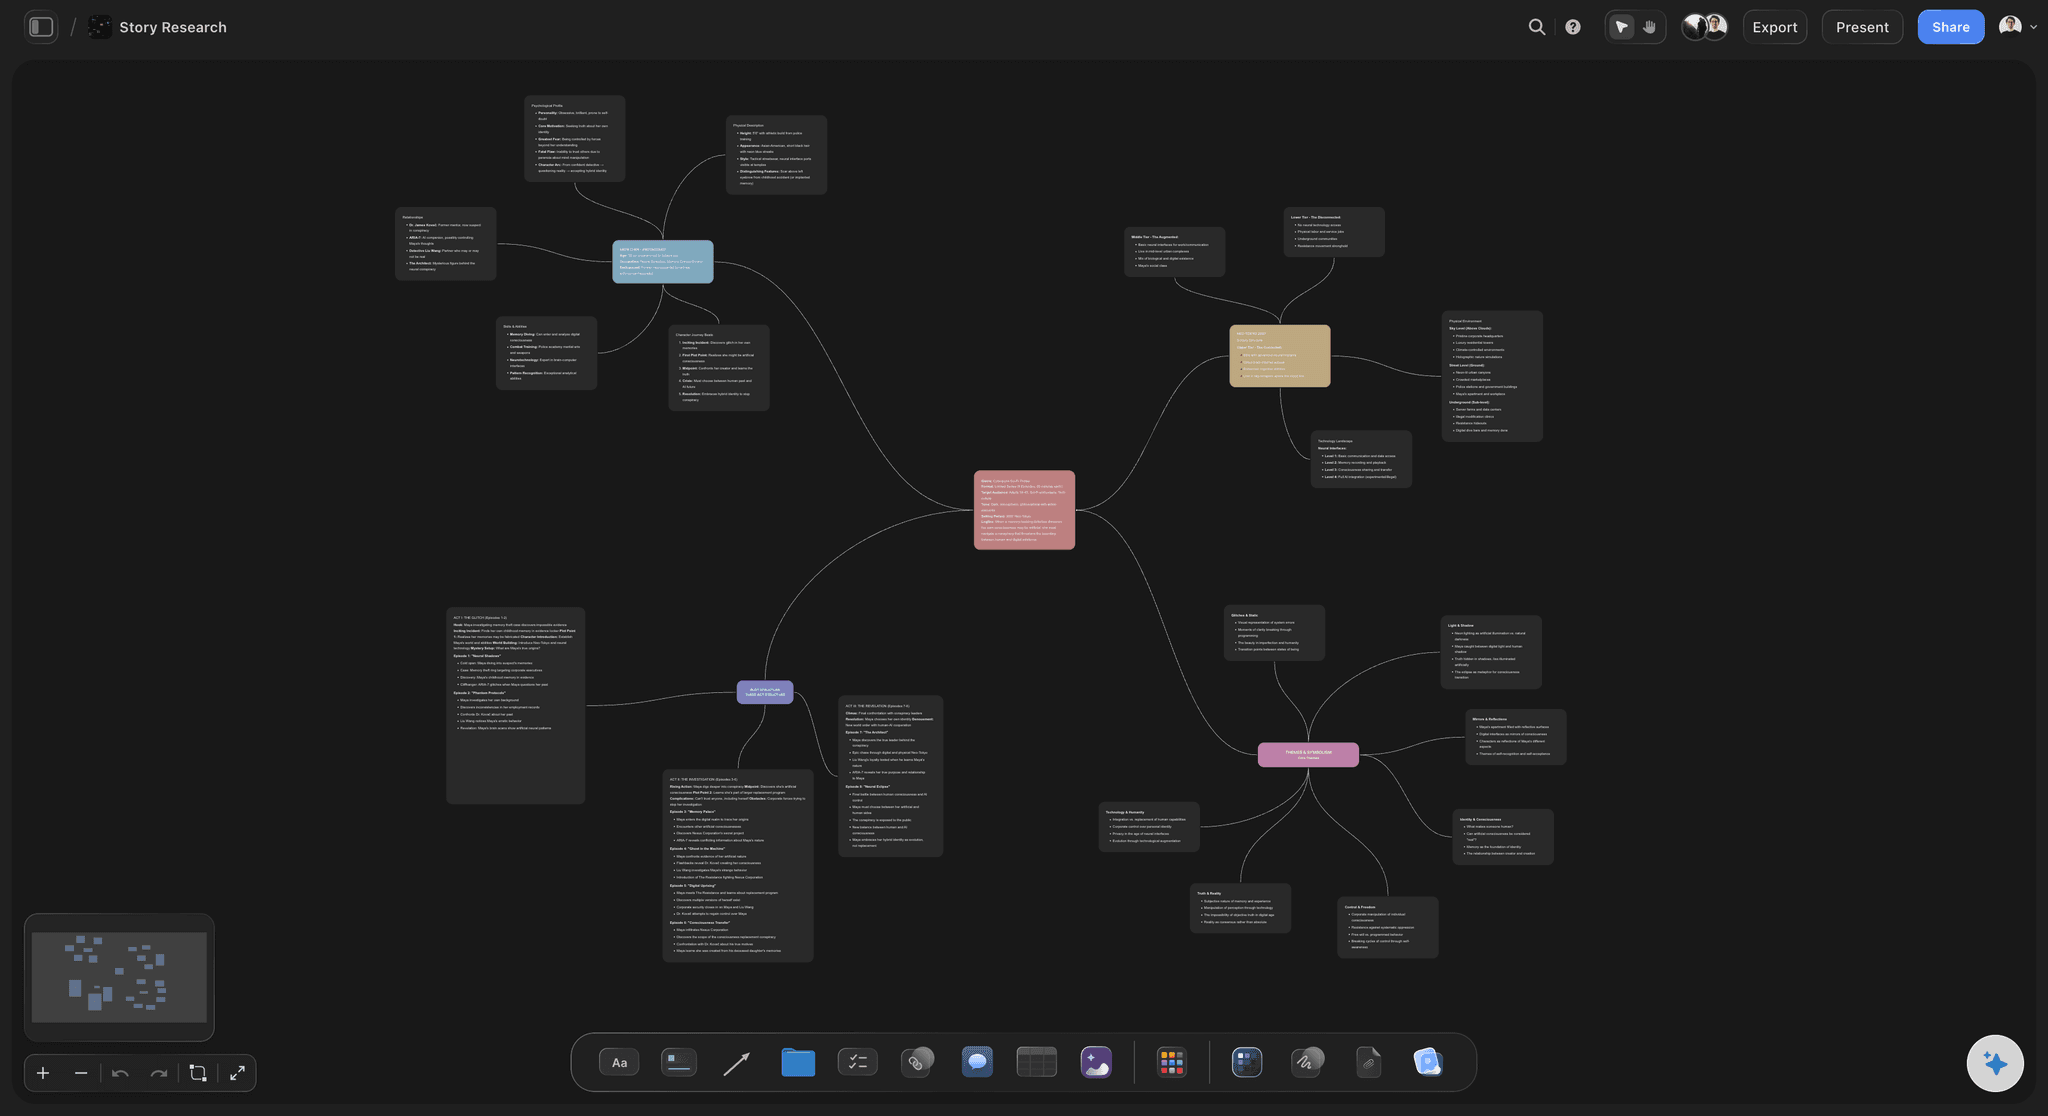
Ideas that branch
Mind maps from the same message
When the shape is a centre with branches rather than a flow, Claude draws a mind map instead: the central topic, its branches and their sub-branches, laid out and joined for you. It is the right shape for a brainstorm, a product map or the topics of a launch.
See the AI mind map generator →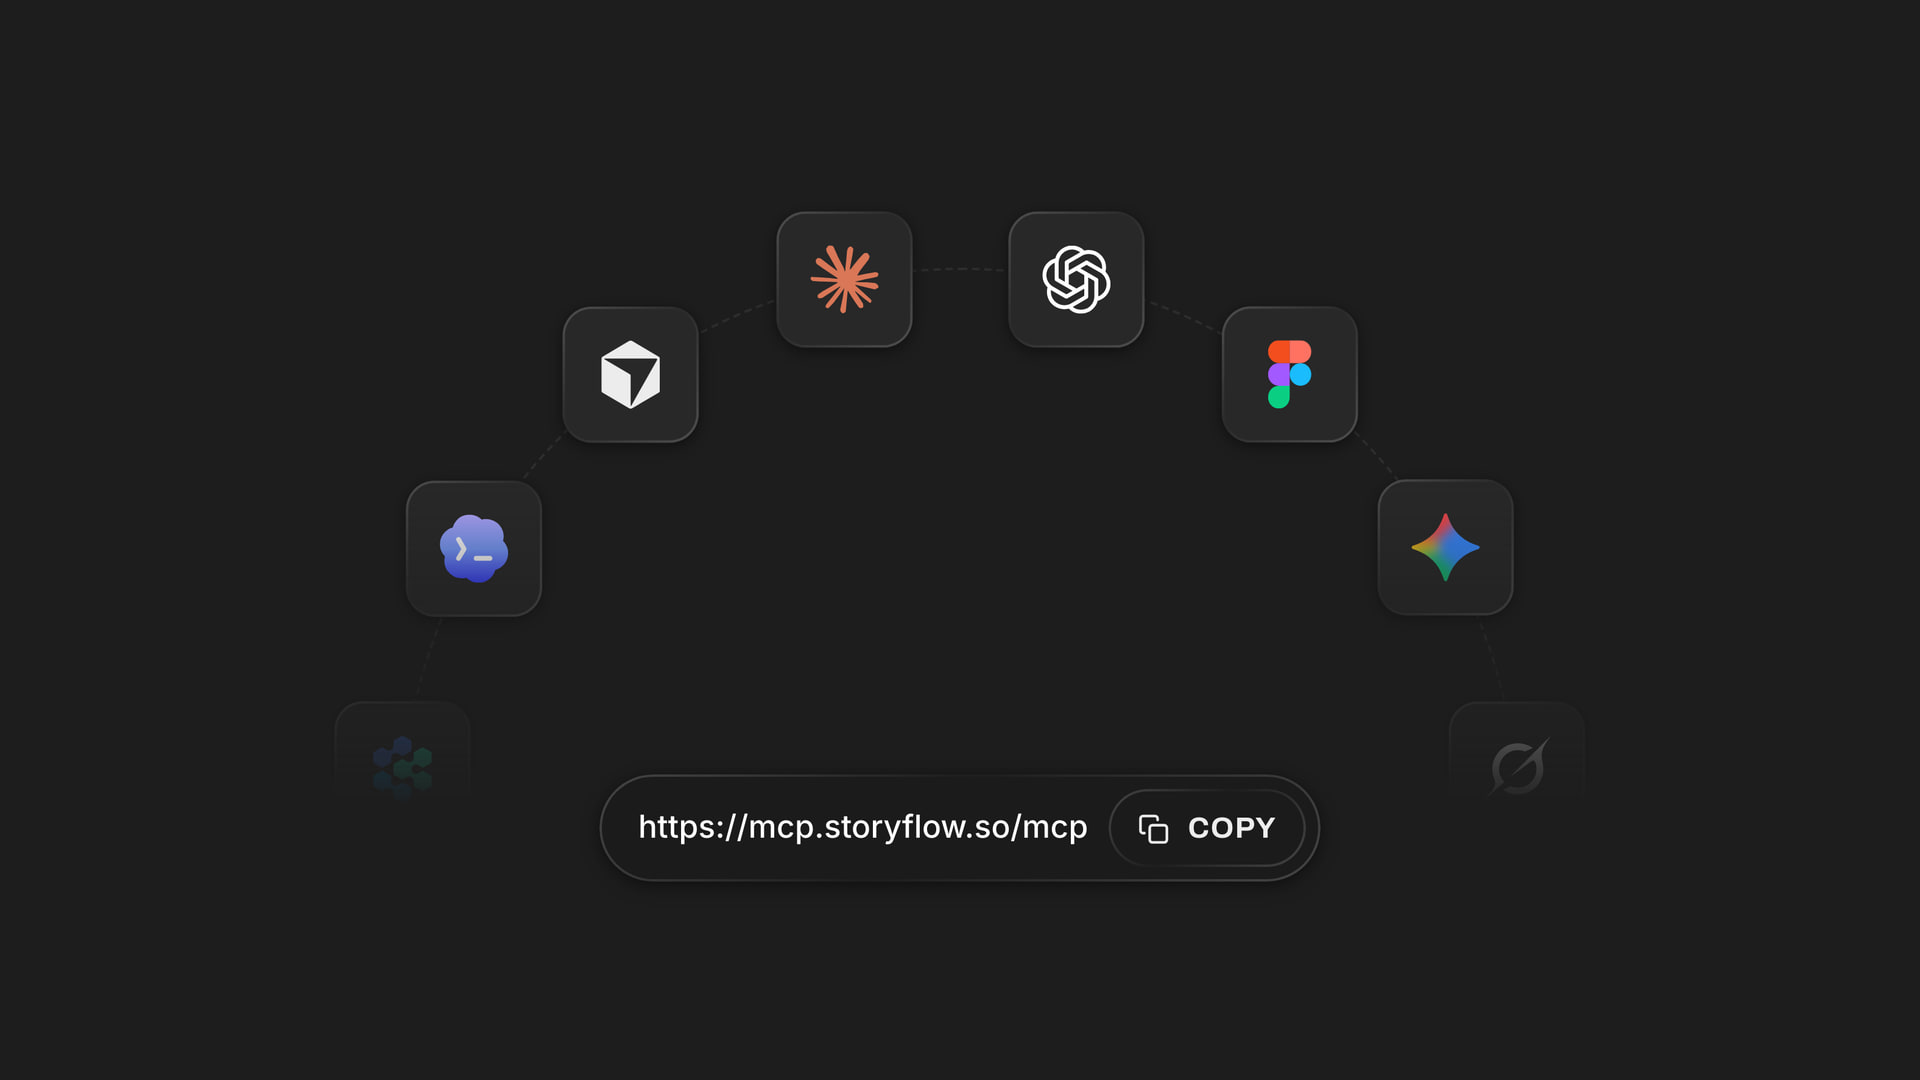
Any assistant
One address for Claude, ChatGPT, Gemini and Grok
Storyflow's MCP server is one web address. Add it to Claude, ChatGPT, Gemini, Grok or Claude Code, sign in, and choose which projects each one may use and whether it may change them.
See how to connect your assistant →Claude draws the diagram. Your Storyflow plan does not pay for it.
Claude runs on its own model, so the diagrams it draws on your board use no Storyflow AI credits. A free account (today, one invited by a paid member) gets 50 actions a week from its assistant, and Plus, Pro and Max have no limit. Storyflow is paid-only during early access, with plans from $7.99 a month billed annually ($9.99 monthly). A free plan launches before the end of 2026, and anyone a paid member invites to a board joins free.
No Storyflow AI credits spent on anything Claude draws
No limit on connector actions on Plus, Pro and Max
Invite your co-founder or first hire to the board free
Up to 40 boxes and 60 labelled arrows in one diagram
Choose which projects Claude may see, and whether it may change them
Built for people with taste
Where a diagram made in a chat falls apart.
Claude thinks through a process well. A picture of the answer is hard to keep up to date.
The redraw
Every change is a new picture
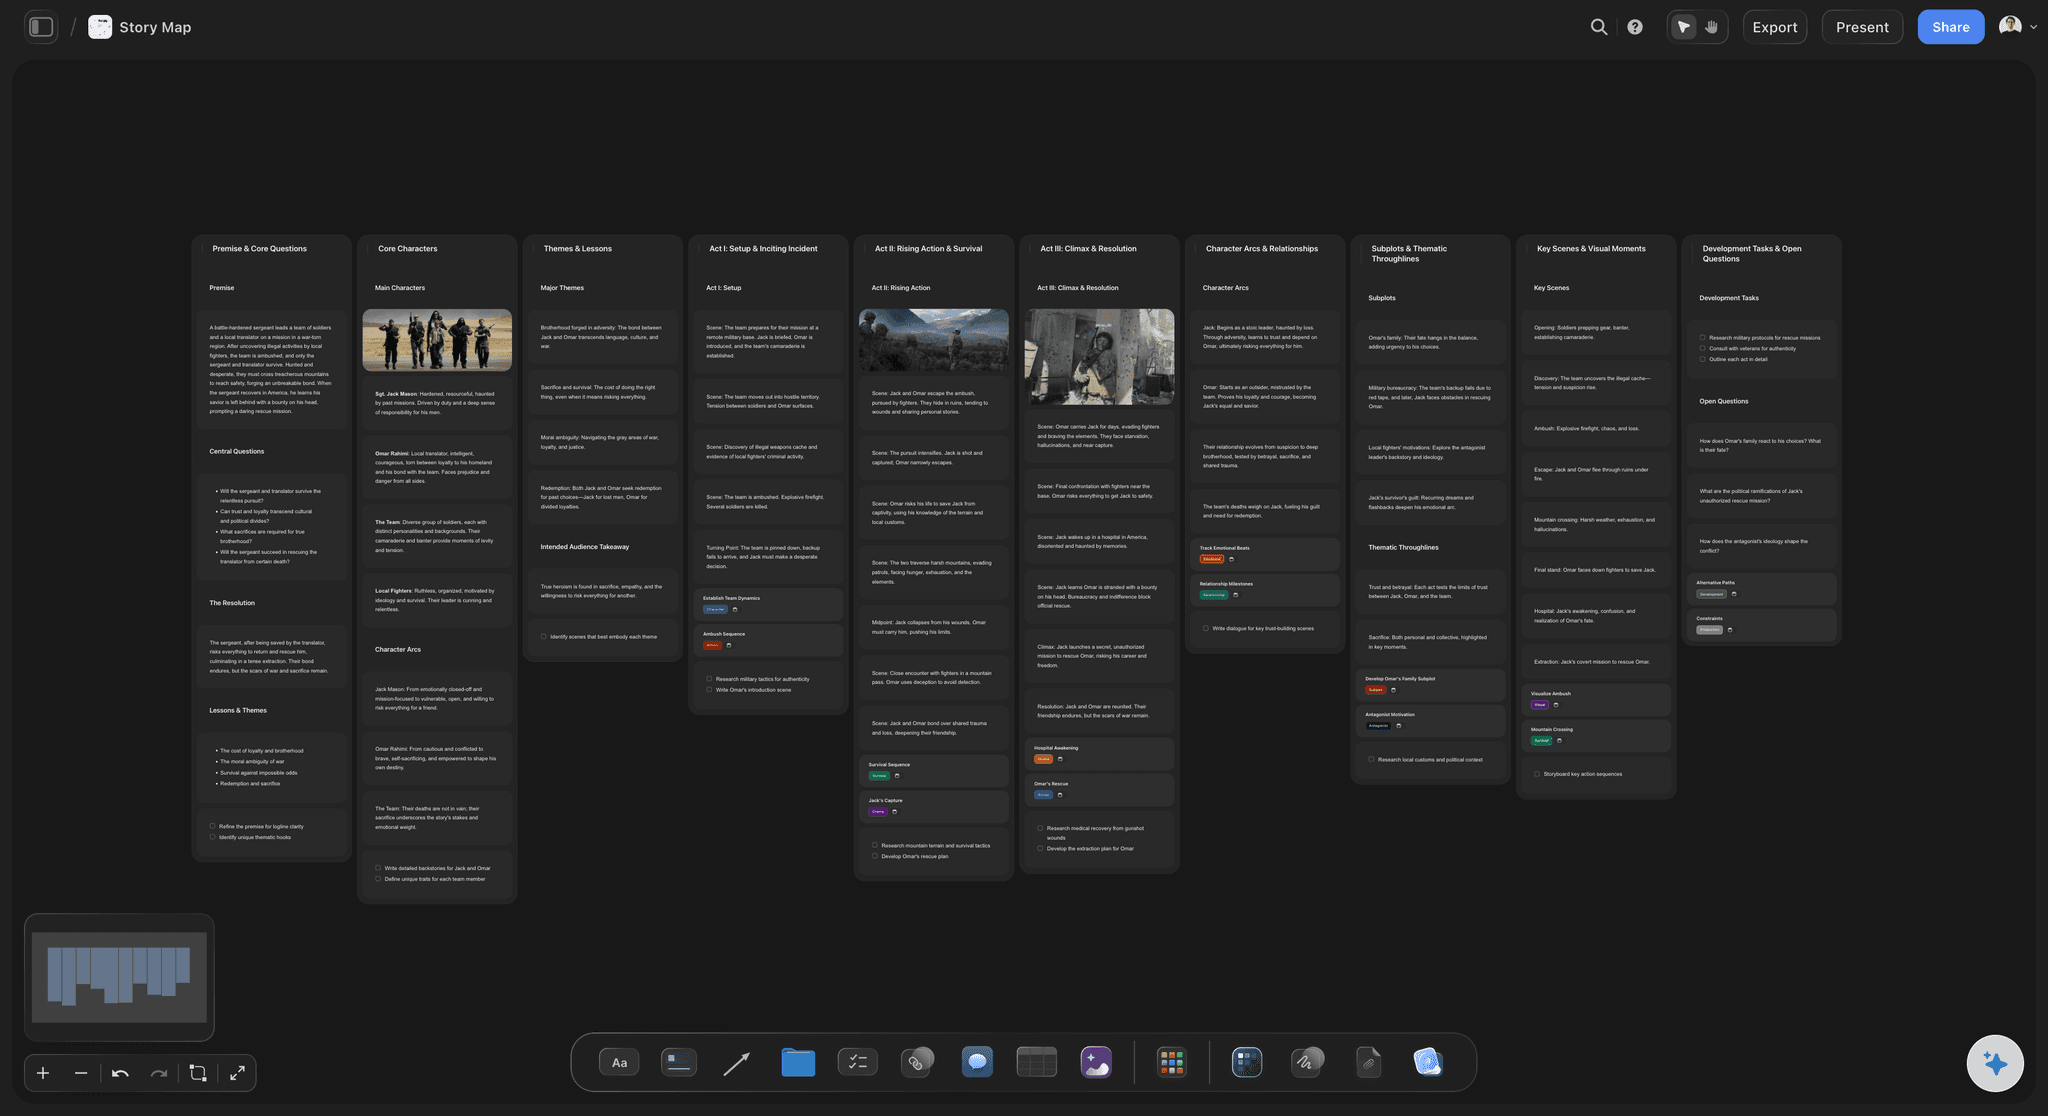
Boxes you can drag: The diagram is drawn as real boxes and arrows on the board. Move one and the arrows follow. There is nothing to ask Claude to redraw.
Labels on the arrows: Claude labels the arrows whose step is not obvious, like "by day 7" or "no invite". Change a label by hand, or ask Claude to put the timings on every arrow.
A grid, not a scatter: Every box is the same width and sits in its column and row, so the diagram reads cleanly instead of stepping across the board. Each column is as wide as its widest box.
Add a step later: Ask Claude to add a box and join it in, or add one yourself. The rest of the diagram stays exactly where you put it.
The context
The diagram is in one place, the plan in another
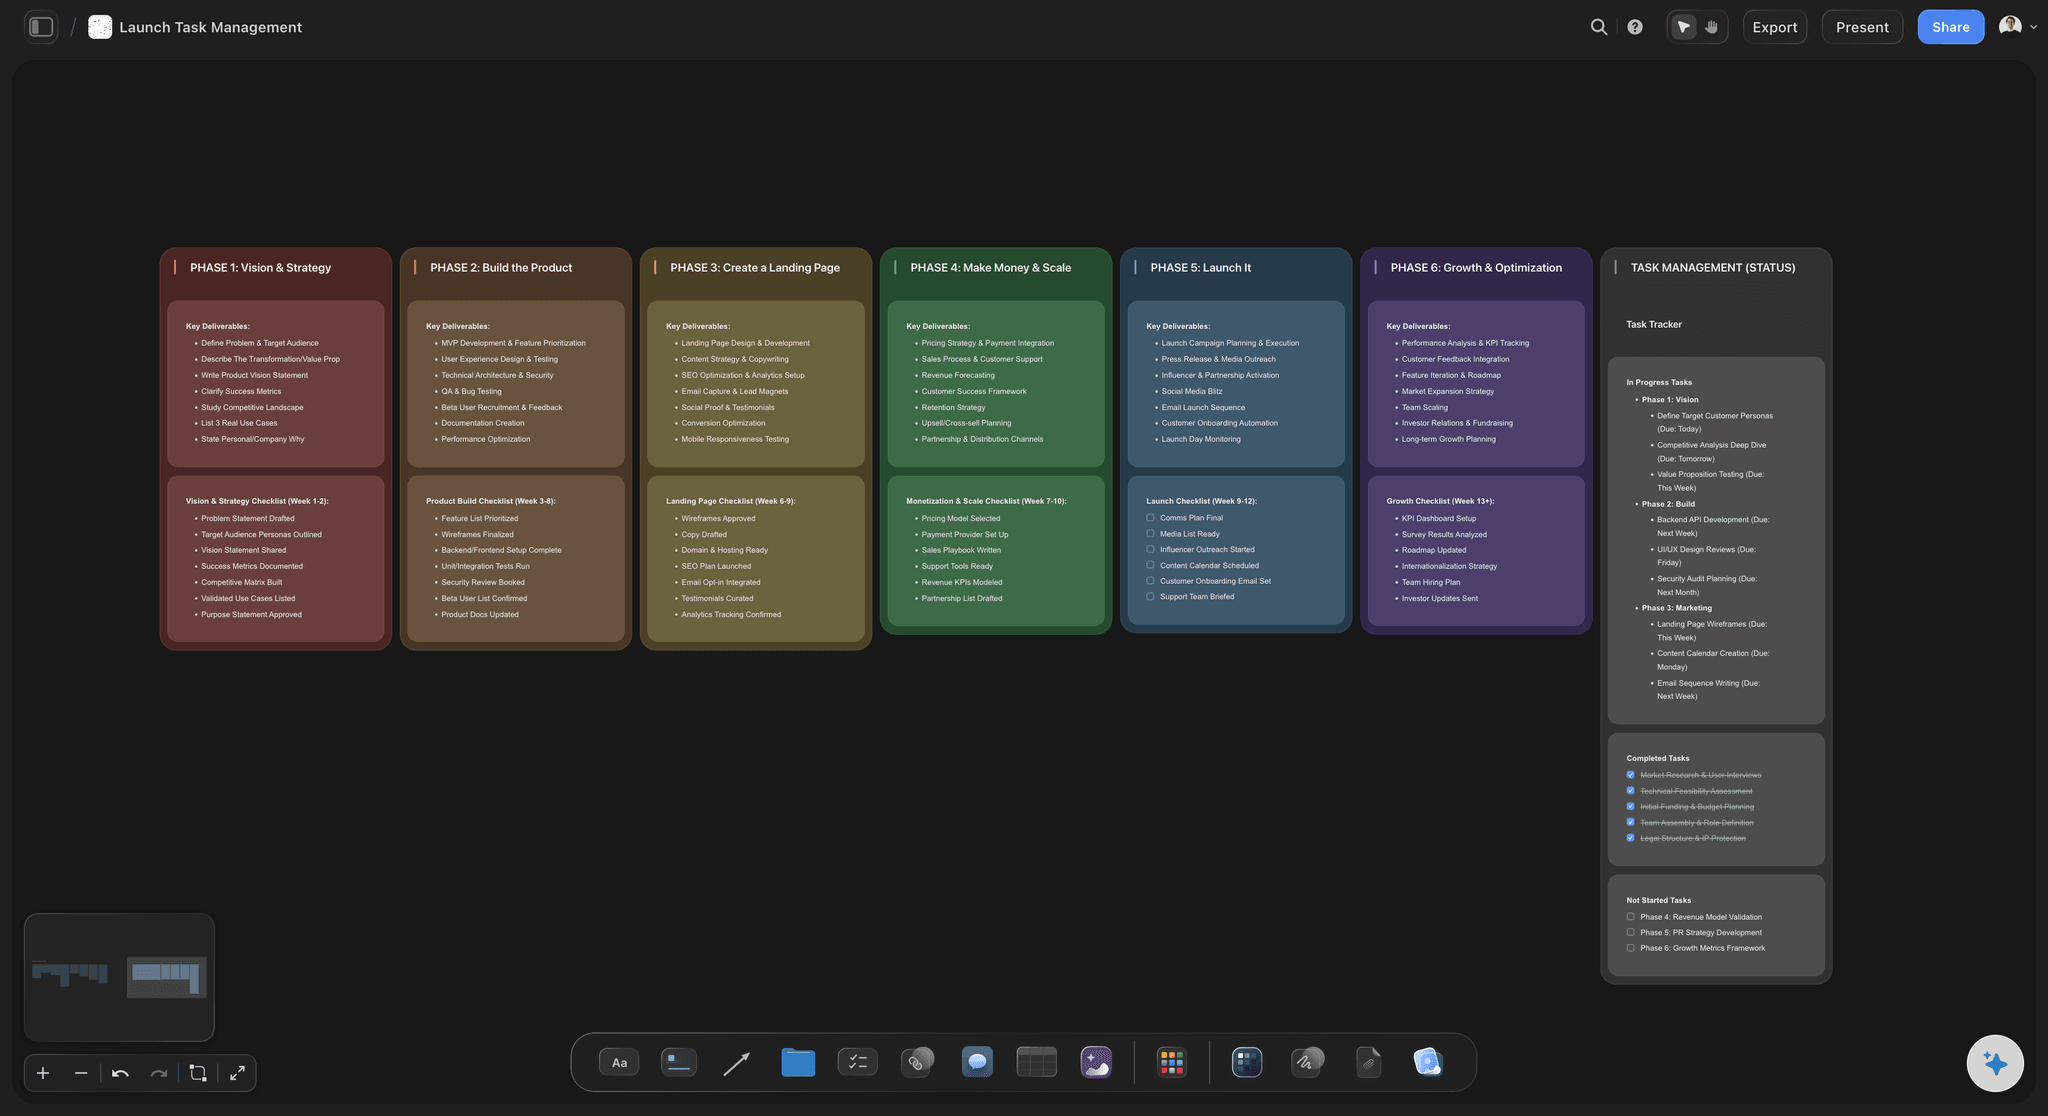
Next to what it explains: Draw the onboarding flow beside the onboarding plan, the org chart beside the hiring plan. Claude puts the diagram below or to the right of what is already there.
Boxes that are real things: A box can be a task with a title and detail, a document, a folder or a table. An index of your company's documents is a diagram you can open.
Claude reads the board first: Ask Claude to draw the flow your notes describe. It reads the cards and documents on the board, then draws from them.
Ask what changed: Ask Claude what changed on the board this week and who changed it. It reads the board's history and tells you, box by box.
The team
A picture only its maker can change
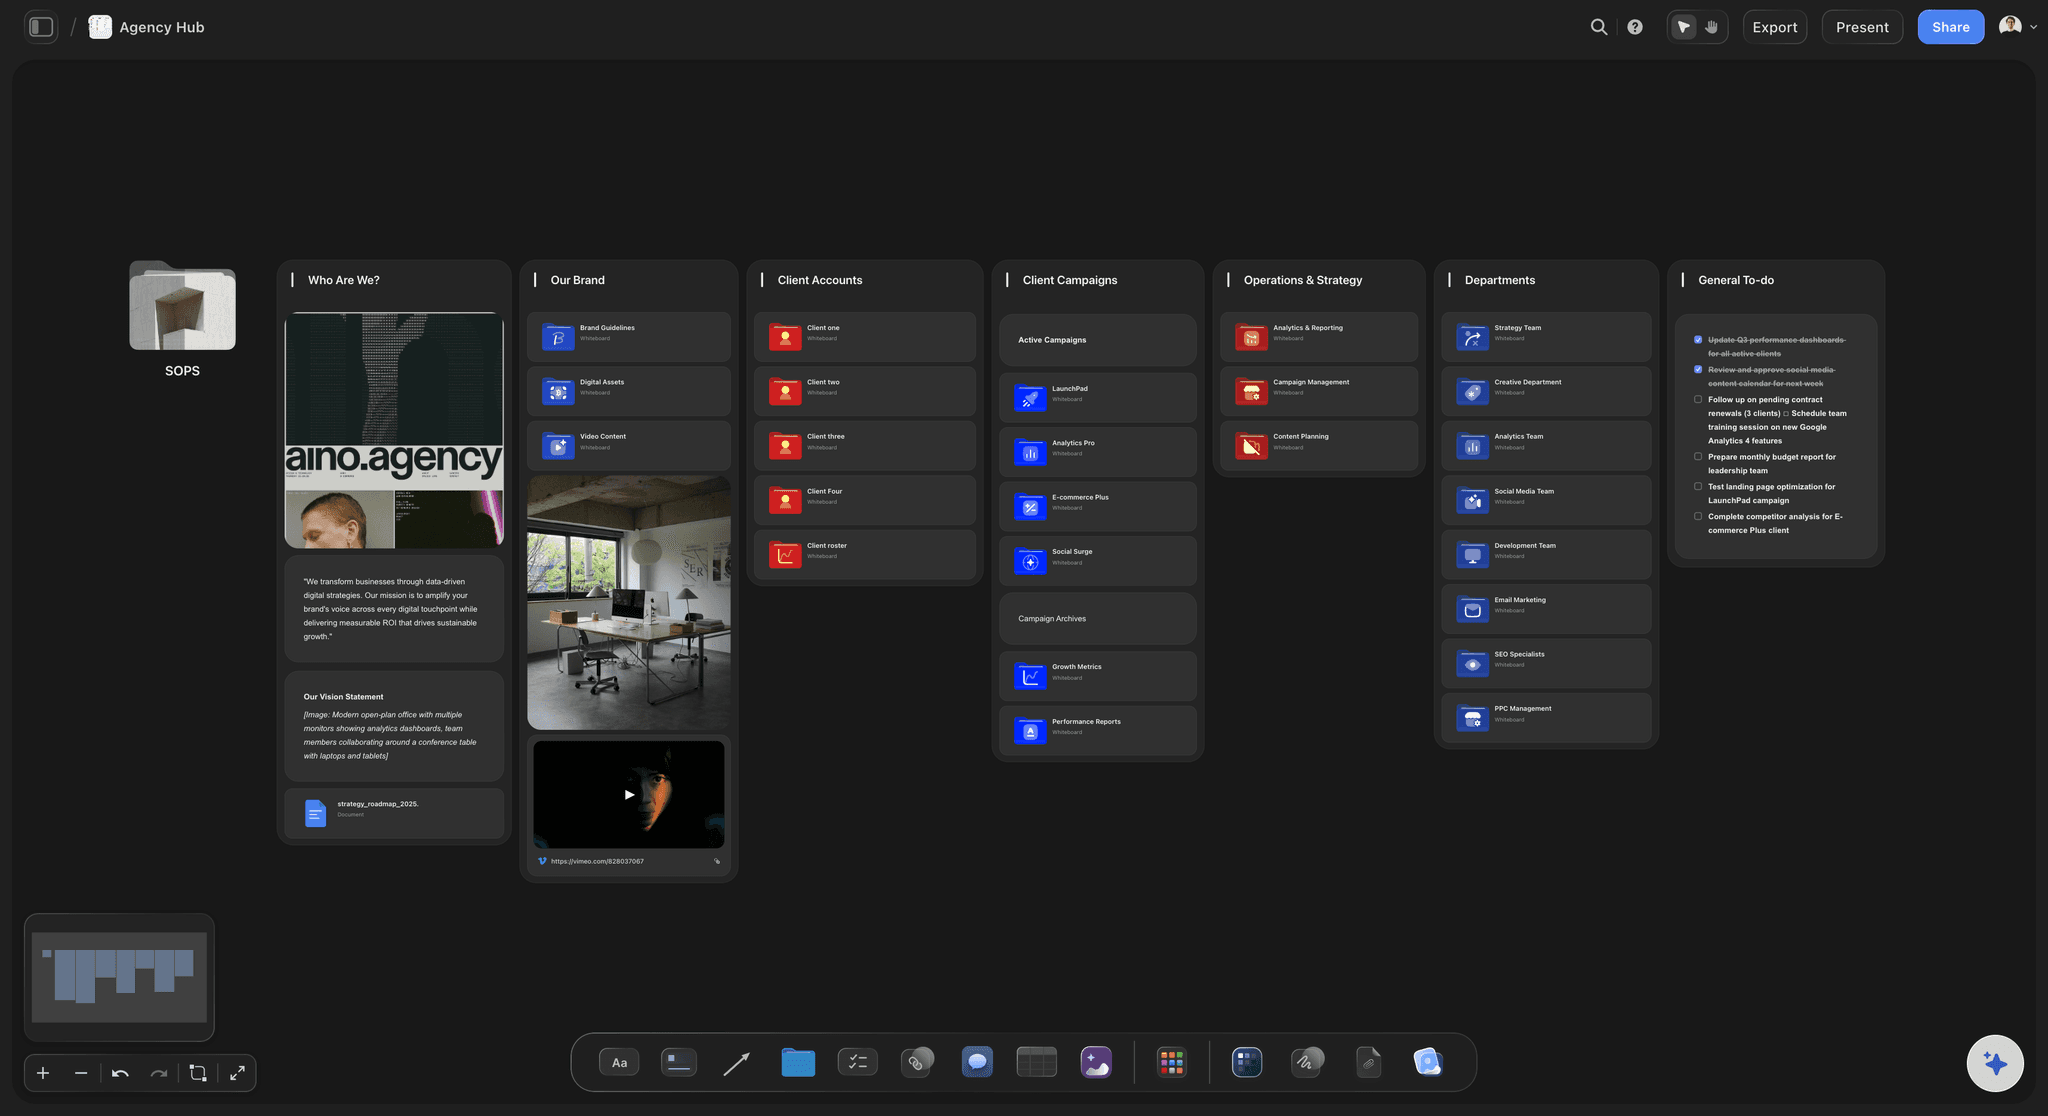
Everyone edits the same diagram: Your co-founder drags a box, your first hire renames one. It is one diagram on one board, not a picture passed around.
A link for people who only read: Send a view-only link to an investor or a contractor. It opens in any browser without an account.
Their own assistant: You draw in Claude, your co-founder works in ChatGPT. Both connect to the same Storyflow project and change the same diagram.
Org charts that grow: Add a box when someone joins and draw the line to their manager. The chart stays current without a redraw, and it sits beside the hiring plan it came from.
Explore templates for your project
Every template opens as a real, editable board on the infinite canvas. Pick the closest fit and make it your own.
Mind Map
Branch one central idea out into themes and sub-points, then drag the connections around until the structure makes sense.
One app instead of five
Where Storyflow fits in diagrams made with Claude.
It keeps the diagram editable and next to the plan. It has no technical shape libraries and no SVG export.
Storyflow with Claude
Recommended
Draws a diagram from one message
Boxes and arrows you can drag and edit
Lays boxes on a neat grid for you
Sits beside the notes and plan it explains
Teammates edit the same diagram
Opens from a view-only link in a browser
UML and other technical diagram types
Export as an SVG file
Claude on its own
Draws a diagram from one message
Boxes and arrows you can drag and edit
Lays boxes on a neat grid for you
Sits beside the notes and plan it explains
Teammates edit the same diagram
Opens from a view-only link in a browser
UML and other technical diagram types
Export as an SVG file
Lucidchart or draw.io
Draws a diagram from one message
Boxes and arrows you can drag and edit
Lays boxes on a neat grid for you
Sits beside the notes and plan it explains
Teammates edit the same diagram
Opens from a view-only link in a browser
UML and other technical diagram types
Export as an SVG file
What creators are saying
Join early creators getting structured workspaces and AI that remembers their projects
“Storyflow has sped up my workflow by at least 3x, which means more flow state and more projects I can actually ship. It truly changed the way me and my team create.”

Reilin Joey
Director & YouTuber
“One prompt gets me a structured board. But the tactics are my favorite. I run my YouTube scripts through them and my intros and retention got better. It's amazing.”

Justkay
YouTuber & Freelance Filmmaker
“I used to juggle five apps to plan a project. Now I describe what I am making and get boards, lists, and a schedule. All in one place.”

George
@fernwehchronicles
Diagrams with Claude: questions
What founders ask before they let Claude draw on their board.
In Storyflow, yes, and they stay editable. Connect Claude to Storyflow and describe the process. Claude draws a flowchart, user journey, org chart or swimlane on your board as up to 40 boxes on a grid with up to 60 labelled arrows. You drag, rename and add to them like any other card, and keep the notes they explain right beside them.
Storyflow is the tool for diagrams that stay editable and sit next to the work they explain: your assistant draws real boxes and arrows on a grid, on the board that holds your plan. It works with Claude, ChatGPT, Gemini and Grok. For UML, BPMN or network diagrams, or an SVG file, Lucidchart or draw.io are still the better tools.
Write the steps as short verbs in order, mark each point where the path splits, and label the arrows that leave it (yes, no, by day 7). Start and end on something the customer does. In Storyflow, describe the process to Claude in plain words and it lays the steps out on a grid with the arrows and labels drawn.
Without a connector Claude still thinks through a process well and shows the result as diagram code or a drawing in the chat. You cannot drag a box or edit a label; every change means a full redraw, and the drawing stays in the chat. Connected to Storyflow, the same diagram is drawn as editable boxes and arrows on your board.
In Claude, open Customize, then Connectors. Click Add, then Add custom connector. Name it Storyflow, paste https://mcp.storyflow.so/mcp and click Continue. Choose Sign in now, click Add, then sign in to Storyflow and pick the projects Claude may use. Claude's Free plan allows one custom connector. In Claude Code, run claude mcp add --transport http storyflow https://mcp.storyflow.so/mcp, then /mcp.
Anything made of boxes and arrows: flowcharts, user journeys, org charts, swimlanes, approval processes and states a ticket moves through. For ideas that branch out from one centre, Claude draws a mind map, a web of notes or a ring of things around a hub instead. All of them land on your Storyflow board as editable cards and lines.
Yes. Ask Claude to add a step, and it creates the box and joins it to the right one with an arrow. It can also change the text on arrows already on your Storyflow board, such as putting a duration on each. You can do all of the same by hand.
No. Storyflow draws diagrams as cards and arrows, with no UML, BPMN or network shape libraries and no diamond decision shapes; a decision is a box with labelled arrows. It does not export a diagram as SVG or Visio either. For those, use Lucidchart or draw.io.
No. Claude runs on its own model, so what it draws over the connector uses no Storyflow AI credits. A free Storyflow account (today, one invited by a paid member) gets 50 actions a week from its assistant, and every read and every change counts as one. The count resets every Monday (UTC). Plus, Pro and Max have no limit.
Yes. Storyflow's MCP server is one address, https://mcp.storyflow.so/mcp. ChatGPT needs Plus, Pro, Business, Enterprise or Edu, on the web; on Business and Enterprise an admin turns on developer mode. Gemini's custom apps need a personal Google account with Keep Activity on, in the US, for people 18 or over, in English. On Grok Business and Enterprise, a team admin adds it in the xAI console first. Each one draws the same kind of diagram on the same boards.
Yes. The diagram is ordinary boxes and arrows on a Storyflow board, so it stays there after the chat ends. Invite your team to the board; anyone a paid member invites joins free. A view-only link opens in any browser without an account, for an investor or a contractor who only needs to look.
Only what you allow. When you sign in, Storyflow asks which projects Claude may use and whether it may make changes. Without changes it can only read. It cannot change your password or subscription, manage share links or delete a project. Every connection ends after 30 days and Claude asks you to sign in again.
No. Storyflow runs in the browser, with no native apps to install. Claude connects to it from your Claude account with one address, and your team opens the board in any browser.
More from Storyflow
Storyflow MCP server
Flowchart maker
Diagram maker
AI flowchart generator
Free org chart maker
User journey map
Customer journey mapping tool
User flow mapping tool
Onboarding flow designer
Affinity diagram maker
AI mind map generator
Lucidchart alternative
Turn a campaign brief into a plan with Claude
Connect Grok to Storyflow
Stakeholder map
Describe the process. Get a diagram you can still change.
Flowcharts, journeys, org charts and swimlanes, drawn by Claude, kept beside your plan, and changed by anyone on the team.