
Extremely simple, seriously capable
Describe the process.
Rearrange the chart.
Type how the process actually works and the AI lays it out as connected steps on an infinite canvas. Then do the part software cannot: move the boxes until the diagram matches the thing, and keep it on the same board as the project it explains.


Creatives working for these brands already got early access
- Red Bull
- Canon
- Artlist
- Porsche
See how easy it is to get started
Watch a real project come together, from a blank board to a finished plan, clicked through step by step.
Start from a ready-made template
Pick a board to see what you can build, then let AI fill it in. Every template is a real, editable starting point on the same infinite canvas.

Mind Map
Branch one central idea out into themes and sub-points, then drag the connections around until the structure makes sense.
What does an AI flowchart generator actually save you?
An AI flowchart generator saves you one of the two jobs inside drawing a flowchart: the placement. Storyflow is an AI visual workspace that lays out your process on one infinite canvas: connected steps from a plain description, boxes you can drag, and the chart beside the project it explains. The first job is deciding what the process is: the steps, the order, the branches, the loop nobody documented. The second is placement, drawing boxes, connecting them, aligning them, and redoing the layout every time a step is inserted. The first job needs your judgement. The second is pure overhead, and it is the reason most processes are documented in a paragraph nobody reads instead of in a diagram.
An AI flowchart generator should remove the second job and leave the first alone. Describe the process the way you would explain it to a colleague, including the parts that are messy, and get back a laid-out chart. What you should not get is a chart you cannot change: a generated diagram is a first draft, and the value only appears when you can drag a branch, split a step, or mark the place where the real process diverges from the documented one.
Storyflow generates the chart onto an ordinary infinite canvas rather than into a locked diagram object. Steps are cards you drag, recolour, and group; connections are arrows you redraw. Because it is a canvas rather than a diagram tool, the chart can sit beside the notes, screenshots, and documents that explain it, and the AI can extend it later from the board you already have.
Ultra fast from brief to board
From a description to a diagram you can argue with.
Say what happens. Fix what the AI got wrong. Keep the chart where the work is.
01
Describe the process
In plain language: how a brief moves from client to delivery, how a support ticket escalates, how a video goes from script to publish. Branches and exceptions included.
02
The AI lays it out
Steps arrive as connected cards on the canvas, arranged so the flow reads, rather than as a list you would then have to draw.
03
Move it until it is true
Drag steps, redraw a connection, split one box into two, colour the stage that always goes wrong. This is the part that makes the chart worth having.
04
Keep it beside the work
Leave the chart on the project board with the notes and documents it explains, share a view-only link, or export it as an image or PDF for a document.
A generated chart that behaves like a whiteboard, not a locked object.
Fast to produce, free to rearrange, and able to live next to everything else.
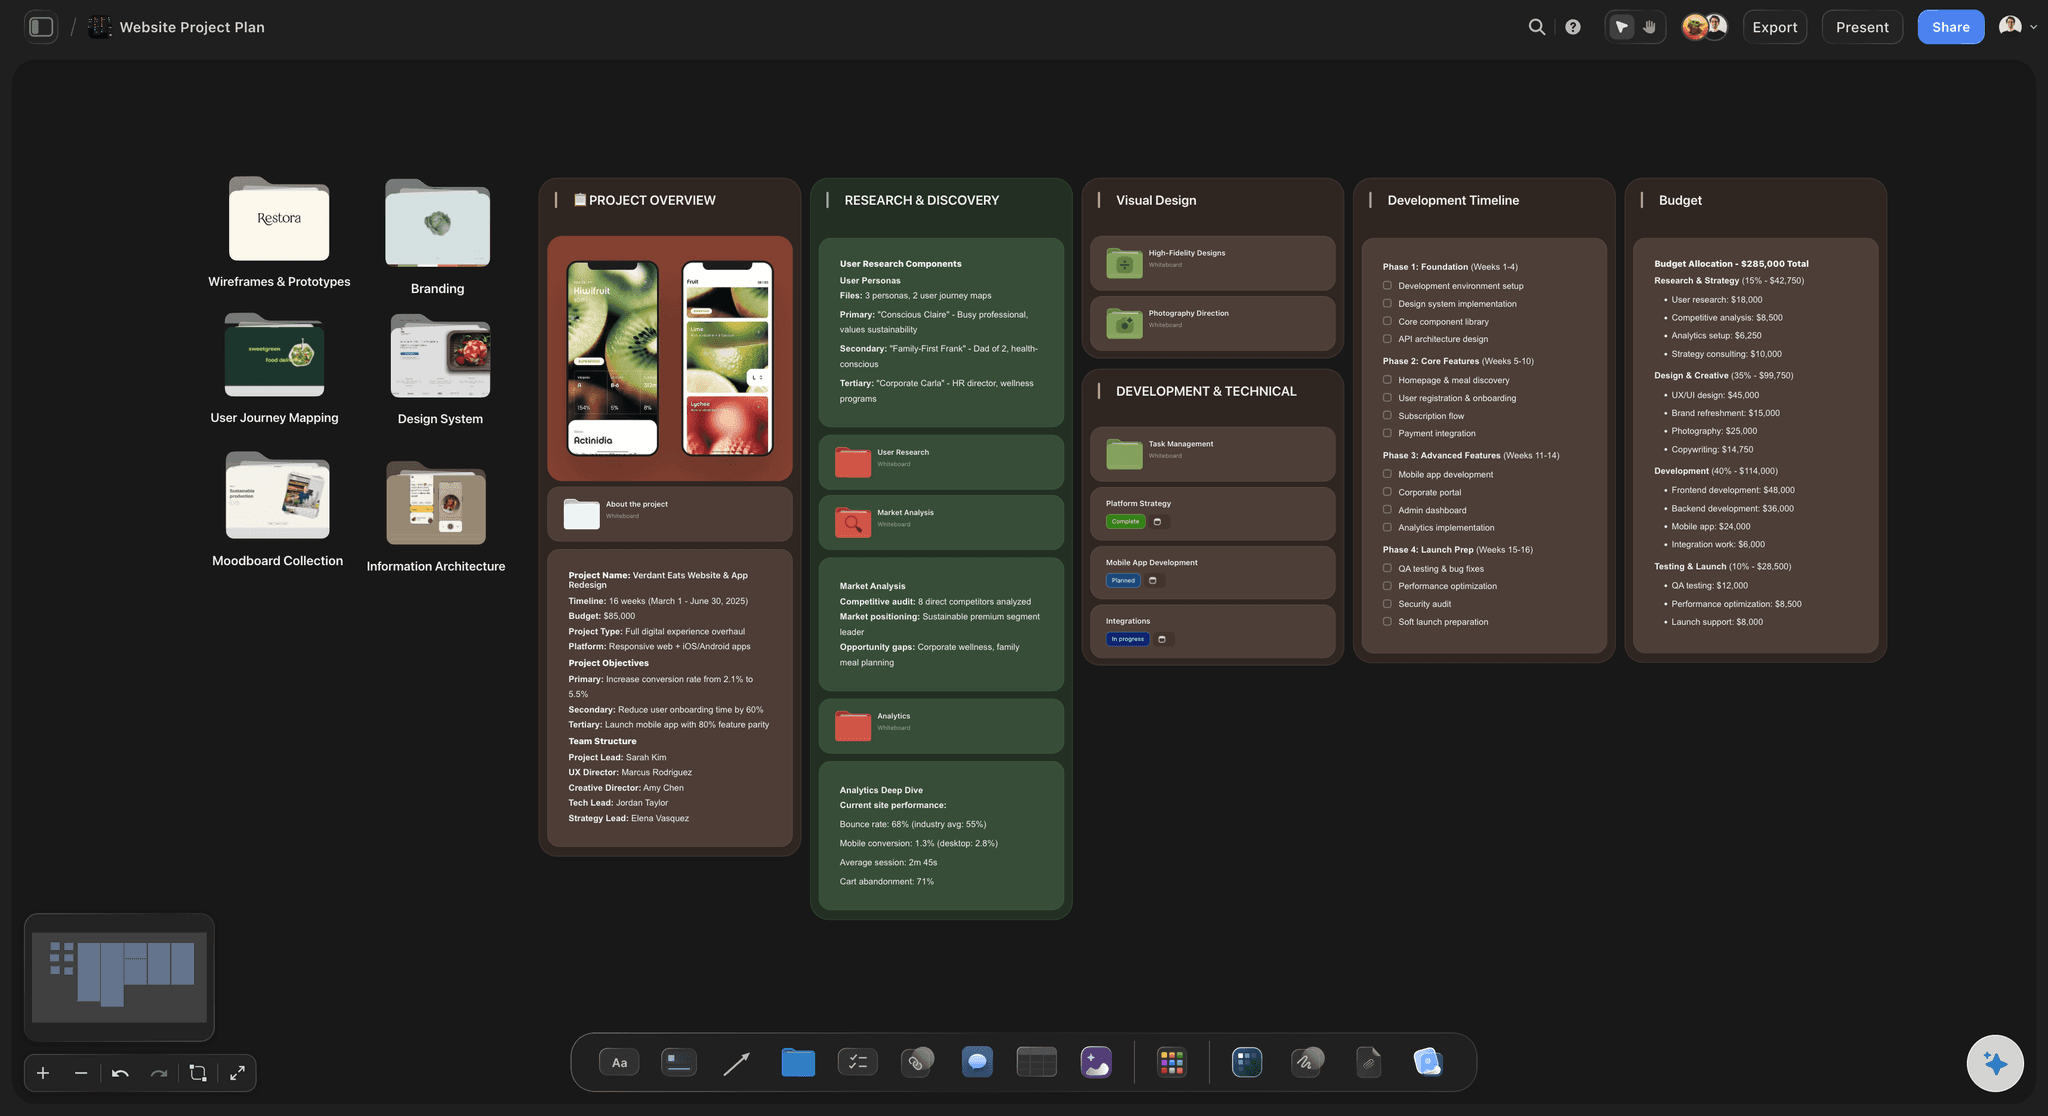
Skip the placement work
Plain language in, laid-out chart out
The tedious half of diagramming is arranging boxes so the flow reads. Describe the process instead and get a laid-out first draft, so your effort goes to whether the process is right.
See the flowchart maker →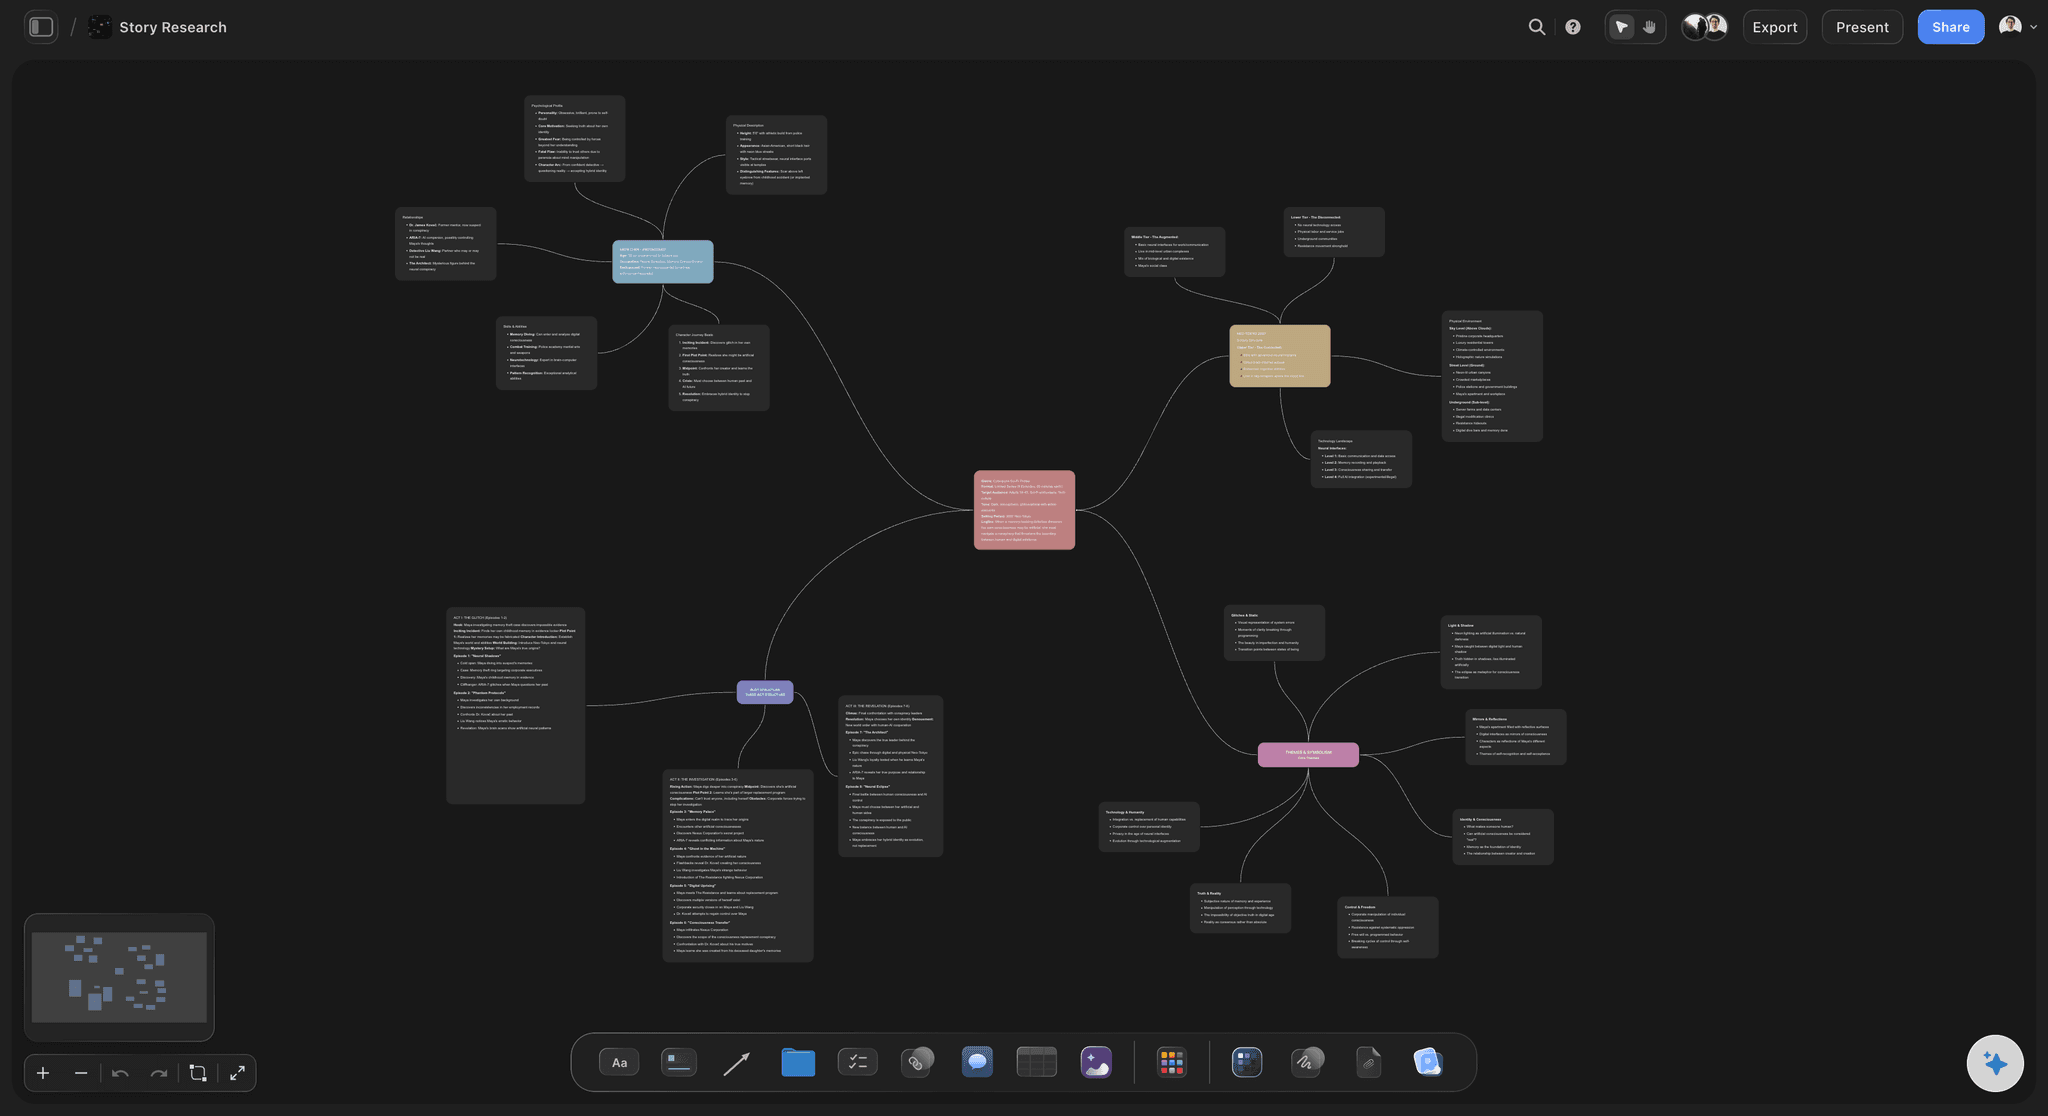
A draft, not a verdict
Every step stays draggable
Generated diagrams are usually locked objects you regenerate to change. Here the output is ordinary cards and arrows on a canvas, so correcting the AI is dragging a box rather than rewriting the prompt.
See the diagram maker →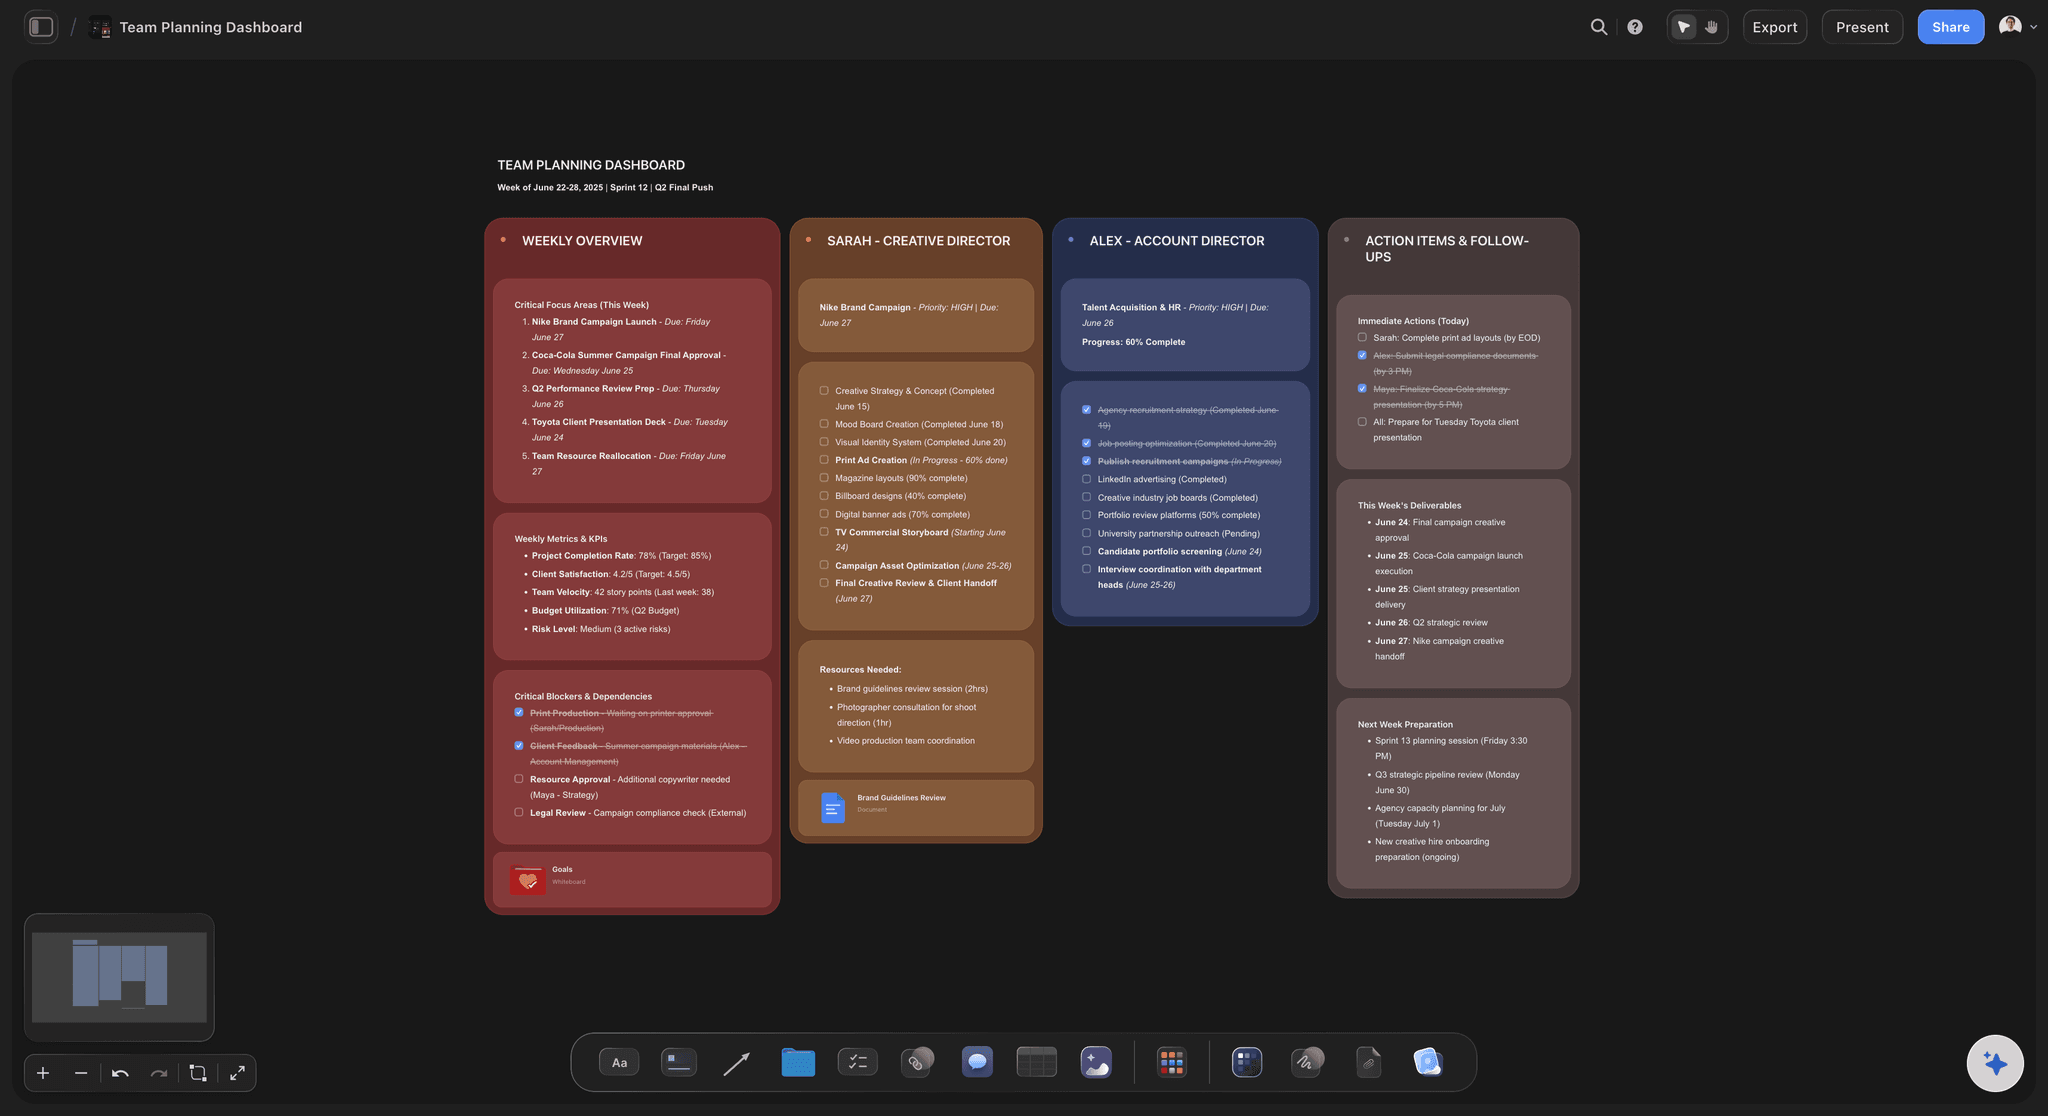
Context on the same board
The chart beside what it explains
A process diagram is most useful next to the screenshots, notes, and documents that show the process. On a canvas they coexist instead of living in a diagramming app and a wiki that disagree.
See the online whiteboard →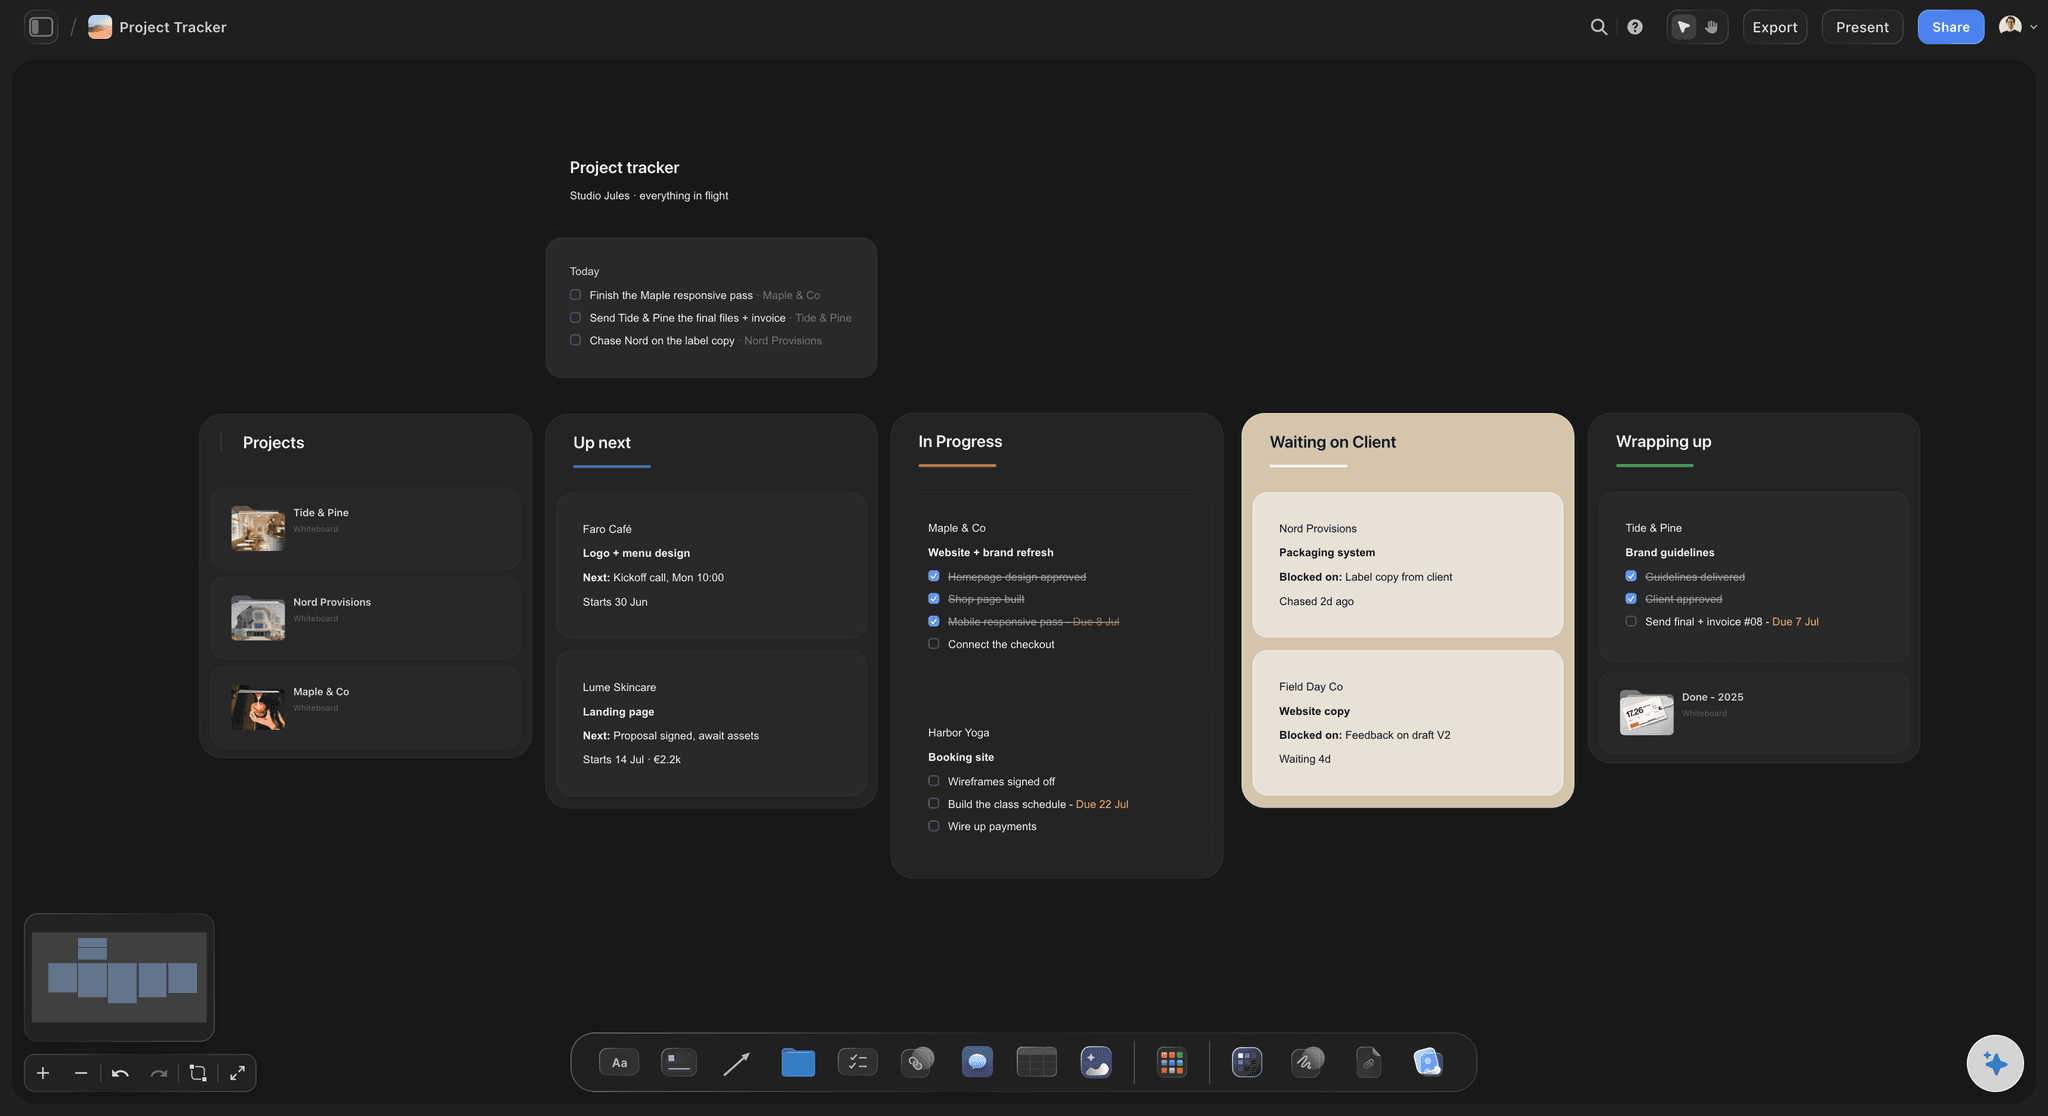
It grows with the process
Extend it from the board later
Because the AI reads the board you have open, coming back in three months and asking it to add the new approval stage extends your chart instead of generating an unrelated second one.
See the AI whiteboard →No cap on steps, branches, or the version you kept for comparison.
Real processes have more branches than a tidy diagram admits. An infinite canvas with no object cap means the chart can be as complicated as the process actually is.
Unlimited boards and objects on an infinite canvas, no object cap
AI usage to generate and extend charts from a prompt
Screenshots, PDFs, and links on the same board as the diagram
Unlimited collaboration, or share view-only with no account needed to view
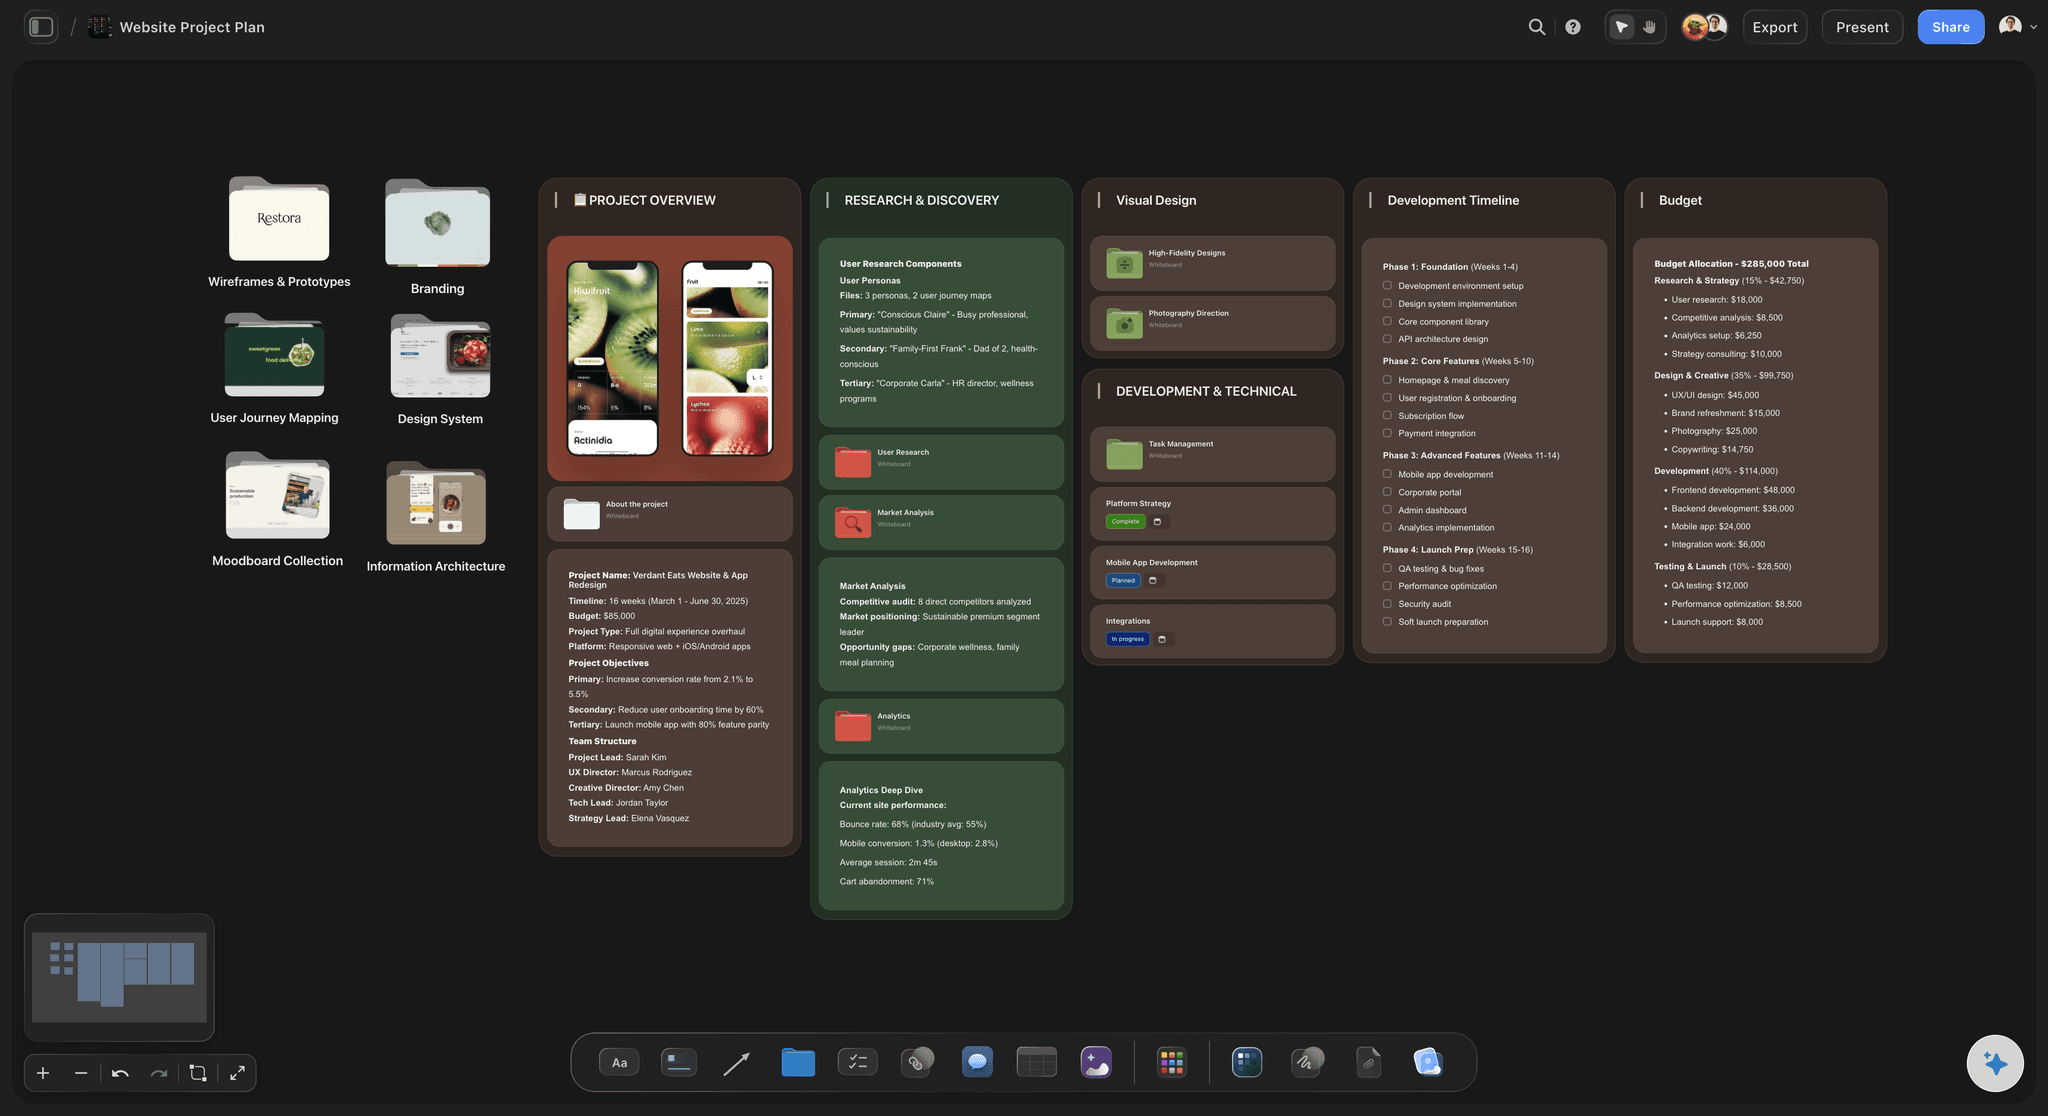
Built for people with taste
The diagrams teams actually need.
Processes, approvals, user journeys, and pipelines, generated fast and corrected by hand.
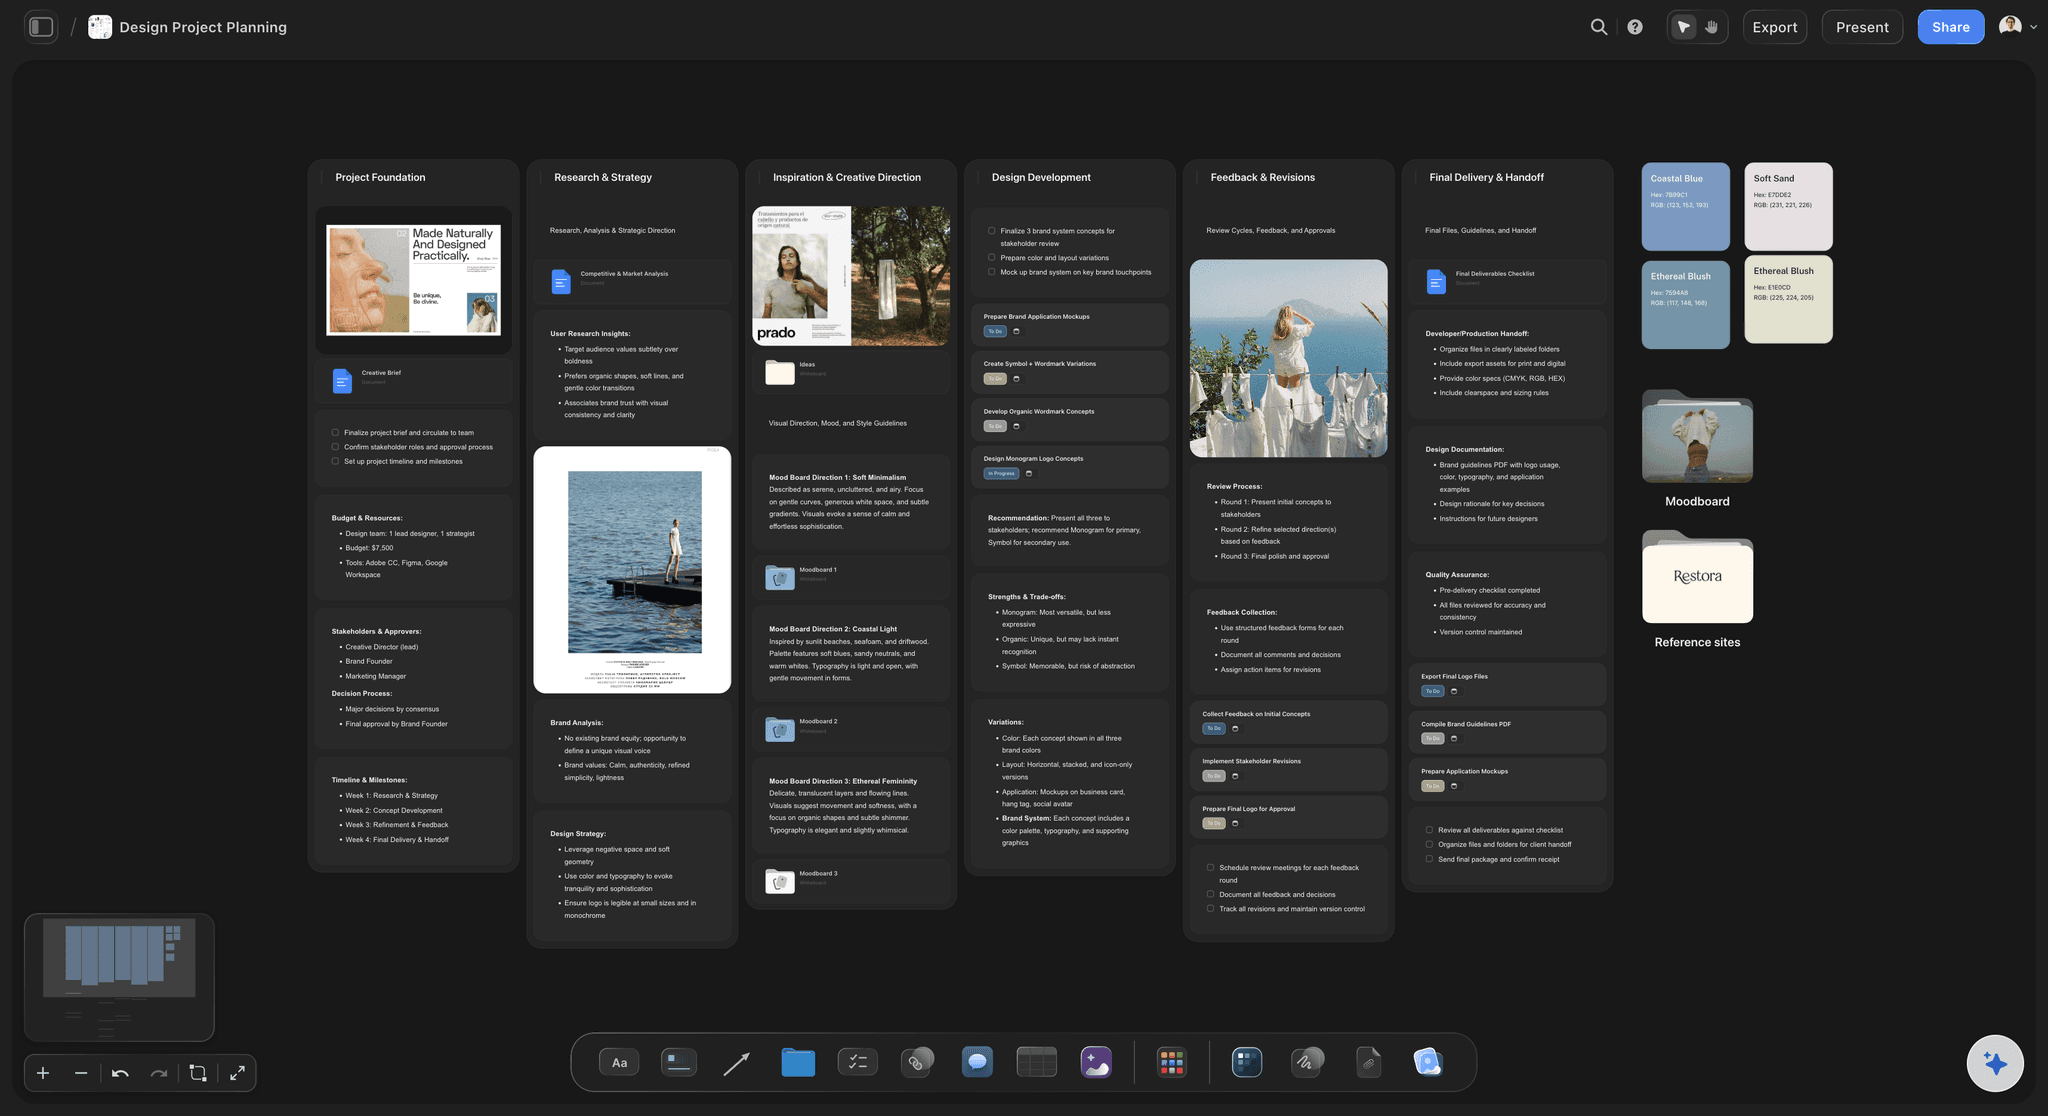
Process and approval flows
How work really moves
Brief to delivery: Chart how a piece of work travels from request to sign-off, including the review loop everyone pretends is one round.
Mark the failure point: Colour the stage that always slips. A chart that shows where a process breaks is worth more than a tidy one that shows the official version.
Branches and exceptions: Describe the exceptions in the prompt and they arrive as branches rather than being smoothed into a straight line.
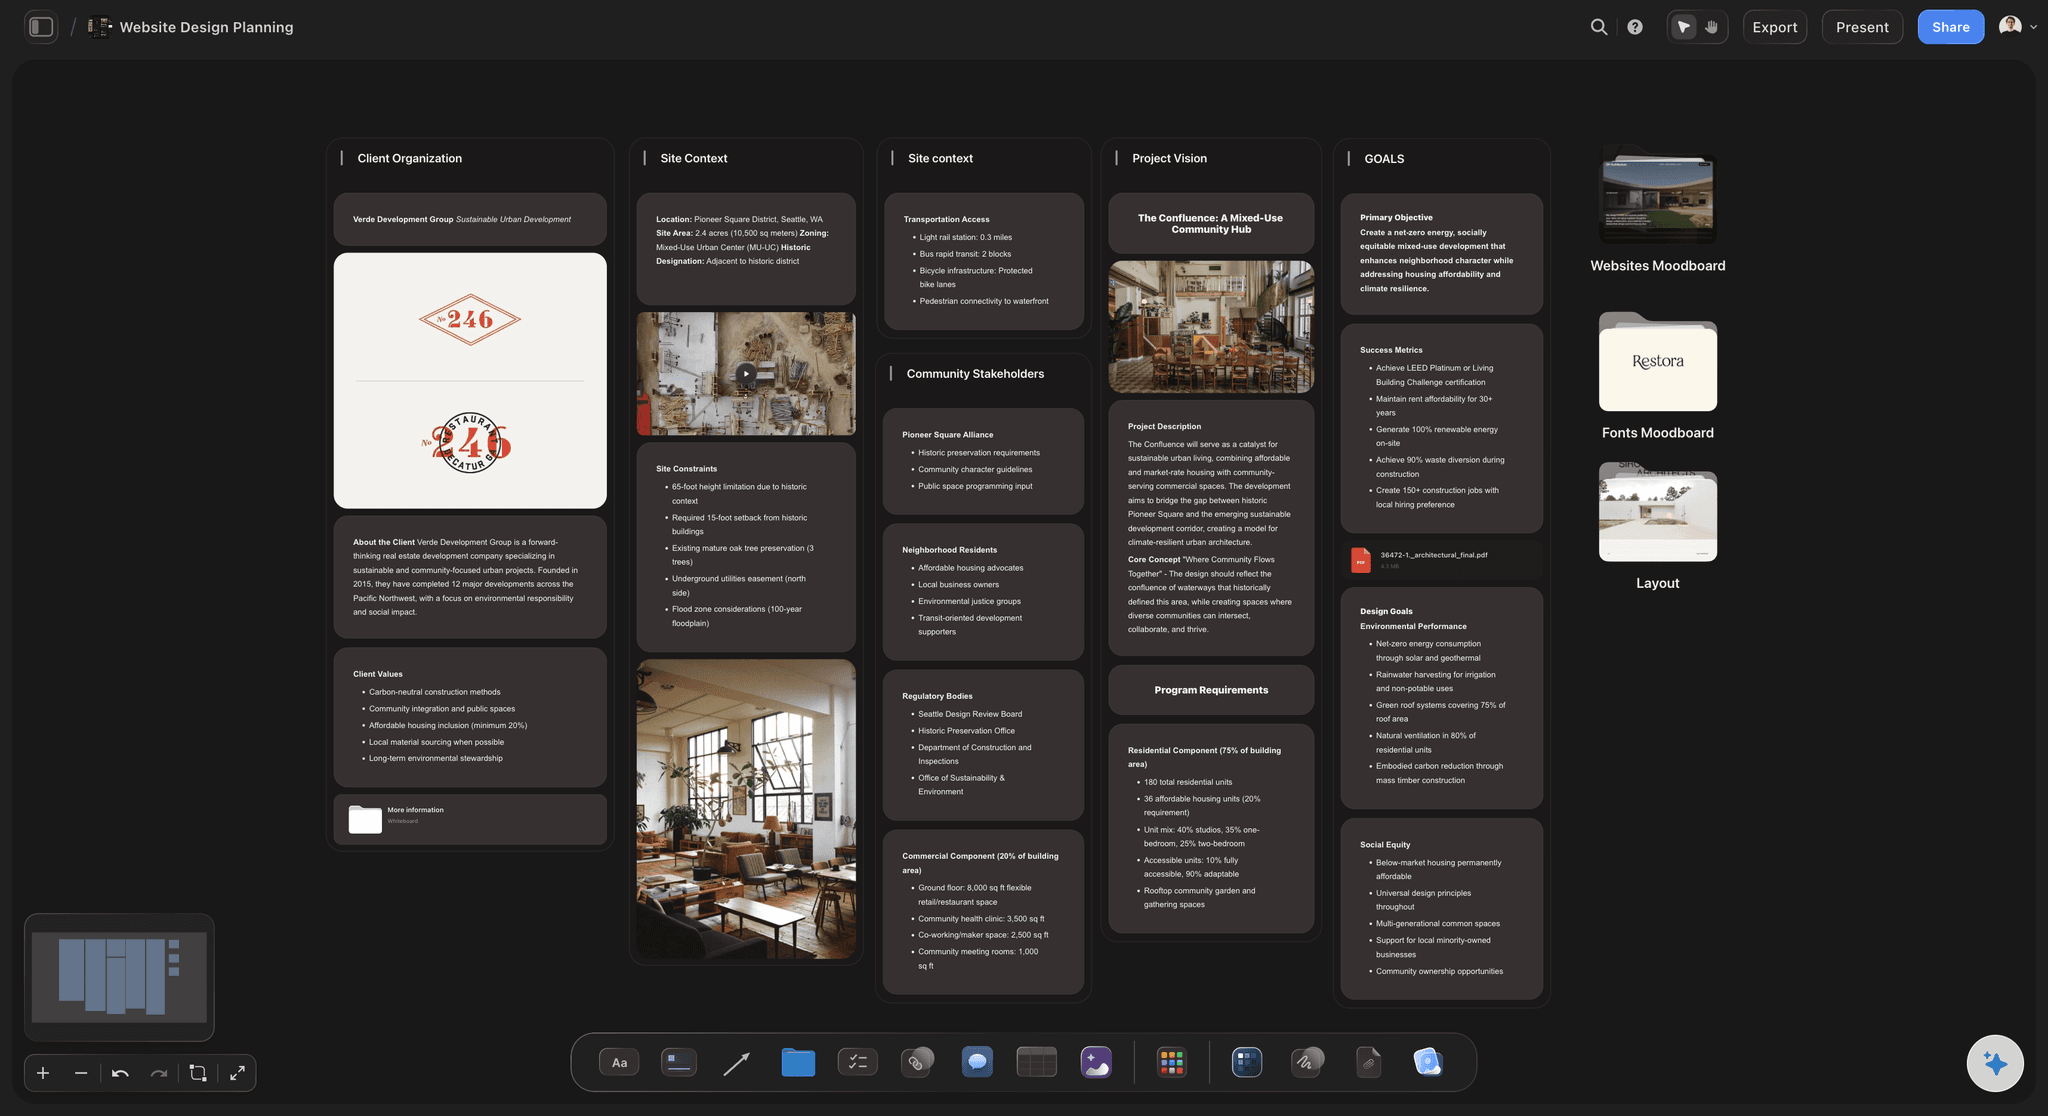
Journeys and funnels
The path a person takes
User flows: Lay out the screens or steps a person moves through, with the decision points where they drop out marked as branches.
Screenshots inline: Drop the actual screen beside its node so a flow review argues about the real interface rather than about a labelled box.
Annotate as you go: Notes sit beside the step they concern, so a review's conclusions stay attached to the diagram instead of ending up in a thread.
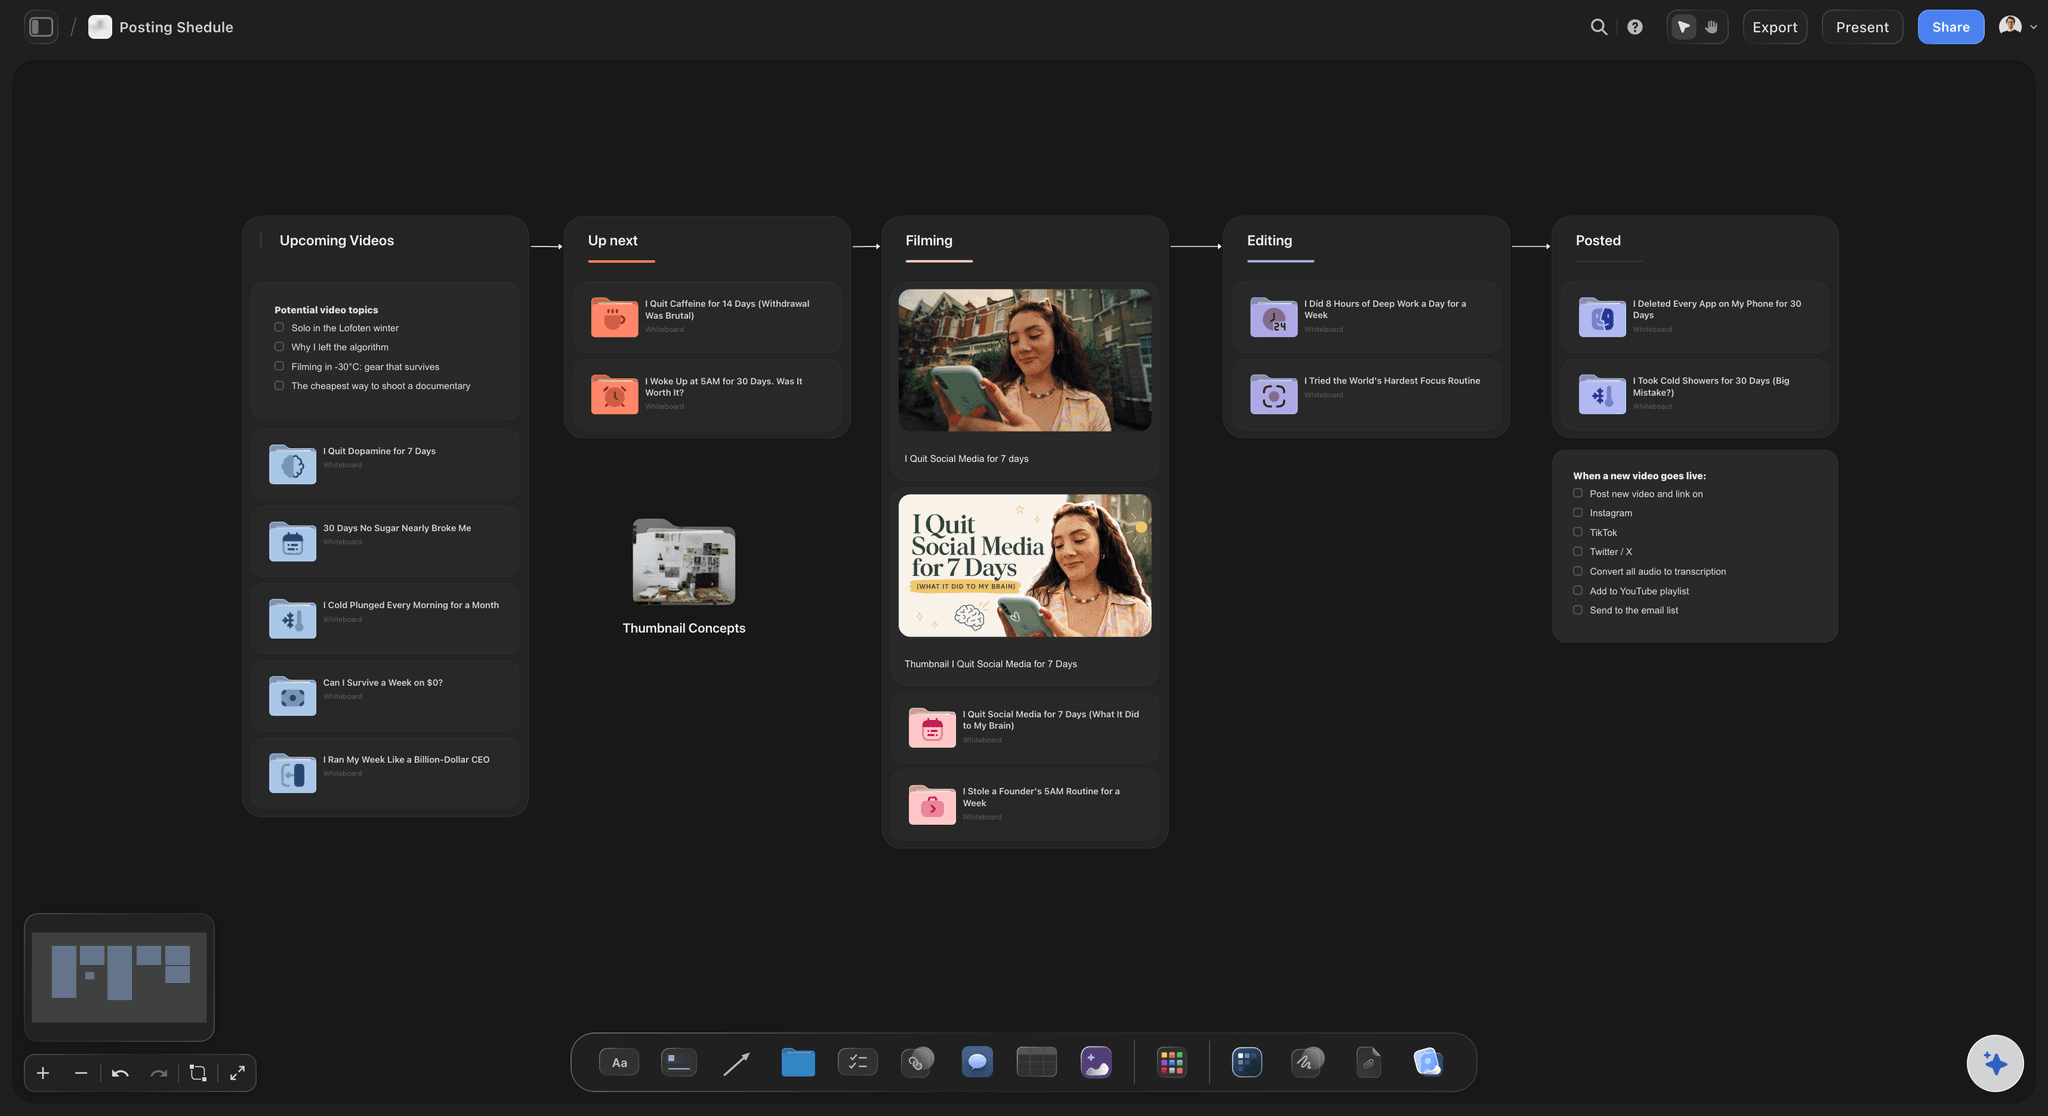
Pipelines and production
Sequences with owners and stages
Content and production pipelines: Chart how an idea becomes a published piece, with the stage names your team actually uses rather than a generic template's.
Owners on the step: Put the person or role on the card, so the diagram answers who as well as what.
Turn it into a plan: Ask the AI to convert the pipeline into a project plan or a calendar on the same canvas when the chart needs to become work.
Sharing it
A diagram people can actually open
View-only links: Send a link that opens the live chart in a browser with no account, no app, and no seat to provision.
Export for a document: One step produces a clean image or PDF when the chart has to sit inside a spec, a deck, or an onboarding doc.
Everyone edits together: Unlimited collaboration on every plan, so a process review happens on the diagram rather than in comments about it.
Explore templates for your project
Every template opens as a real, editable board on the infinite canvas. Pick the closest fit and make it your own.
Mind Map
Branch one central idea out into themes and sub-points, then drag the connections around until the structure makes sense.
What creators are saying
Join early creators getting structured workspaces and AI that remembers their projects
“Storyflow has sped up my workflow by at least 3x, which means more flow state and more projects I can actually ship. It truly changed the way me and my team create.”

Reilin Joey
Director & YouTuber
“One prompt gets me a structured board. But the tactics are my favorite. I run my YouTube scripts through them and my intros and retention got better. It's amazing.”

Justkay
YouTuber & Freelance Filmmaker
“I used to juggle five apps to plan a project. Now I describe what I am making and get boards, lists, and a schedule. All in one place.”

George
@fernwehchronicles
AI flowchart generator questions, answered.
What people ask before trusting a machine with a diagram.
You describe the process in plain language and the model turns the description into steps, branches, and connections, then places them on a canvas so the flow reads left to right or top to bottom. The generation handles the placement work. Deciding whether the process is correct is still yours, which is why the output has to stay editable.
Storyflow turns a plain description of a process into a chart you can still change: its AI lays the process out as connected steps on an infinite canvas, and every step stays draggable. You rearrange, annotate and extend the chart until the diagram matches the real process. Then it stays on the same board as the project it explains.
Yes, and this is the main thing to check in any generator. Storyflow produces ordinary cards and arrows on an infinite canvas, so you drag a step, redraw a connection, split a box, or recolour a stage directly. You are not required to rewrite the prompt and regenerate to make a small correction.
Write the process as you would explain it out loud, in order, and include the branches: what happens if it is rejected, what happens if the client is late. Vague descriptions produce vague charts. Naming the roles and the decision points in the description is what turns a straight line into a diagram that reflects reality.
Yes. The same approach covers user flows, approval and review flows, content and production pipelines, onboarding sequences, and service processes. Because it is a canvas rather than a diagram-only tool, you can drop screenshots beside the nodes and keep notes on the same board.
Storyflow is paid-only during early access, with plans starting at $9.99 per month, an infinite canvas, and no object cap. Every plan includes unlimited collaboration and view-only sharing that needs no account to view. A Free plan launches before the end of 2026, with 20 file uploads and basic AI usage to generate and extend charts.
Yes, and it is the reason to generate it here rather than in a diagram-only tool. The chart sits on a board alongside the notes, screenshots, and documents that explain the process, inside the same project, so it is found by the people who need it instead of living in a separate app.
Yes. The AI reads the board you have open, so asking it to add a stage or split a branch extends the chart you already corrected rather than generating a fresh, unrelated one. You can also attach up to five documents and three boards as context, such as a written process doc.
Share a view-only link and anyone opens the live chart in a browser with no account. When it needs to sit inside a specification, a deck, or an onboarding document, export the board as a clean image or PDF in one step.
Let the machine place the boxes. You decide what the process is.
Describe it once, correct it by dragging, and keep the chart beside the work it explains.