
An ultra-fast canvas that stays calm
The connections are
the knowledge.
Notes and sources as nodes, labeled relationships between them, and the holes in your understanding visible as empty space rather than as something you have not noticed yet.


Creatives working for these brands already got early access
- Red Bull
- Canon
- Artlist
- Porsche
See how easy it is to get started
Watch a real project come together, from a blank board to a finished plan, clicked through step by step.
Start from a ready-made template
Pick a board to see what you can build, then let AI fill it in. Every template is a real, editable starting point on the same infinite canvas.

Mind Map
Branch one central idea out into themes and sub-points, then drag the connections around until the structure makes sense.
What is a knowledge graph?
A knowledge graph is information stored as a network rather than as a hierarchy. Storyflow is an AI visual workspace that draws a knowledge graph on one infinite canvas: notes, sources and concepts as nodes, labeled relationships between them, and PDFs, images and video attached to the nodes. Instead of documents inside folders, you have entities as nodes, meaning people, concepts, sources, events, claims, and relationships as labeled edges between them: cites, contradicts, depends on, is an example of, was influenced by. Google popularised the term for the structure behind its search results, and the same idea in a personal or research context is the reason tools like Obsidian and Roam produce a graph view. The claim underneath it is straightforward: the useful part of what you know is usually the relationships, and a folder structure destroys exactly that.
The distinction that matters is between an automatic graph and a deliberate one. Most note tools draw a graph from links you happened to make while writing, which produces a picture that is fascinating to look at and hard to use, because every edge means the same thing, which is that two notes mention each other. A knowledge graph in the useful sense has typed edges. Knowing that a paper cites another paper is worth little; knowing that it contradicts it, or replicates it, or depends on its method, is the thing you actually wanted to record, and it is the thing an untyped link cannot express.
The second thing a graph does that a folder cannot is show absence. A concept with one source behind it looks identical to a concept with fifteen when both are files in a directory. Drawn as a network, the thin node is visibly thin, the cluster nobody has connected to the rest of the work is visibly isolated, and the claim your argument depends on that you have never found evidence for is a node with an empty side. Those are the findings people want from a knowledge base and almost never get, because search answers questions you thought to ask.
Storyflow is an AI-native infinite canvas, and it is deliberately the informal end of this. There is no schema to design before you begin, no query language, and no triple store. Describe what you are working on and the AI lays out the entities it can identify with candidate connections, then you correct it: fix the wrong edges, label what the relationships actually are, drag the clusters apart until the structure means something, and pin the underlying PDFs, quotes, and links to the nodes they belong to.
Ultra fast from brief to board
From a pile of notes to a structure you can read.
No schema, no query language, no ontology decided in advance.
01
Open a canvas
Sign up in seconds. No download. Your infinite graph canvas opens in the browser.
02
Describe the territory
Type the subject and what you are trying to work out. The AI lays out the entities it can identify with candidate connections between them, so you start from a drawn network.
03
Label what the edges actually are
Cites, contradicts, depends on, is an example of. A labeled edge is the unit of knowledge here, and correcting the AI's guesses is where most of the understanding happens.
04
Read it for what is missing
Find the thin nodes, the isolated clusters, and the claims with nothing behind them. Then share a view-only link or export the graph as an image or PDF.
Nodes, typed edges, sources, and the gaps.
A structure that answers questions you did not know to ask.
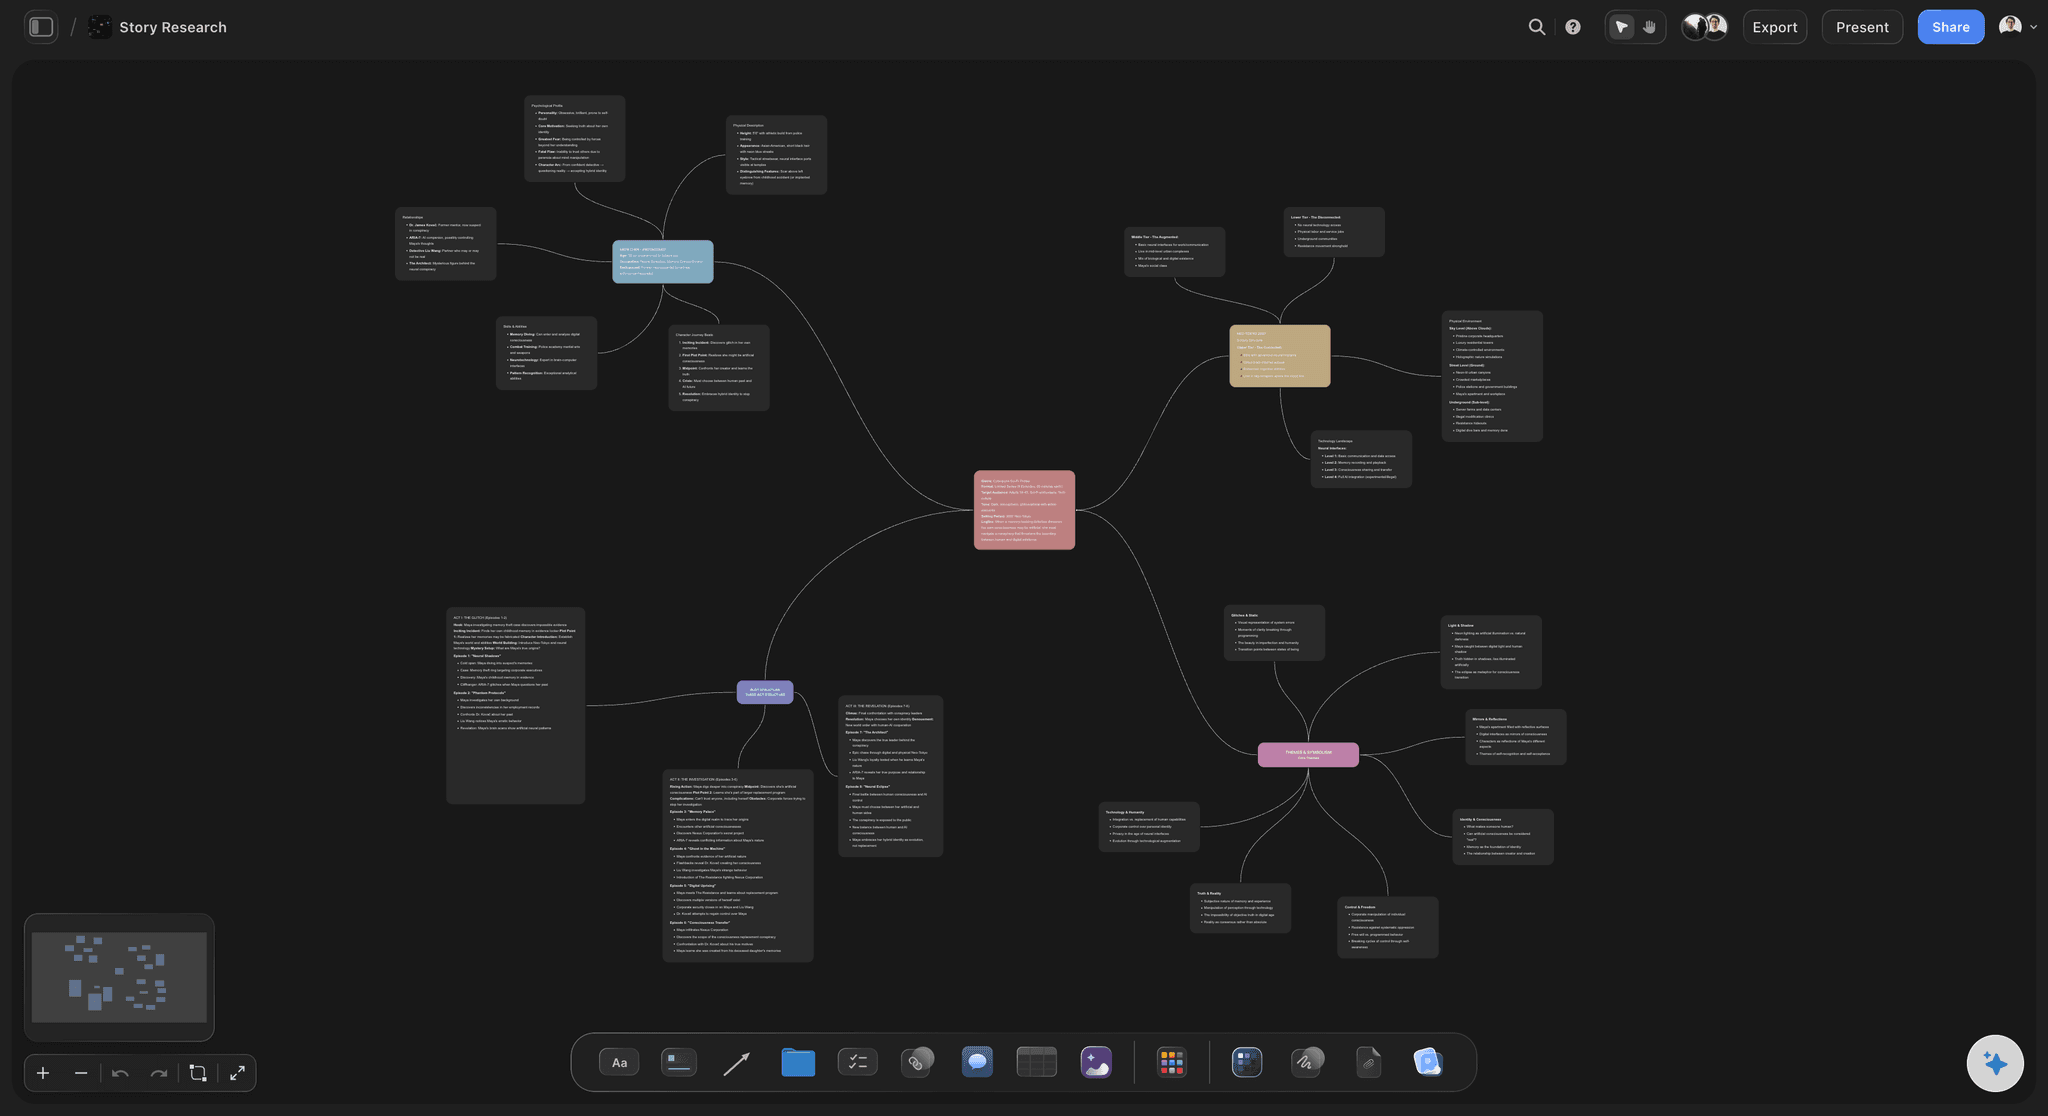
AI extracts entities and proposes the first connections
Start from a drawn network
Describe the subject or drop in your material and the AI lays out the entities with candidate edges between them. Correcting a proposed structure is far faster and far more instructive than building one node at a time.
See the AI mind map generator →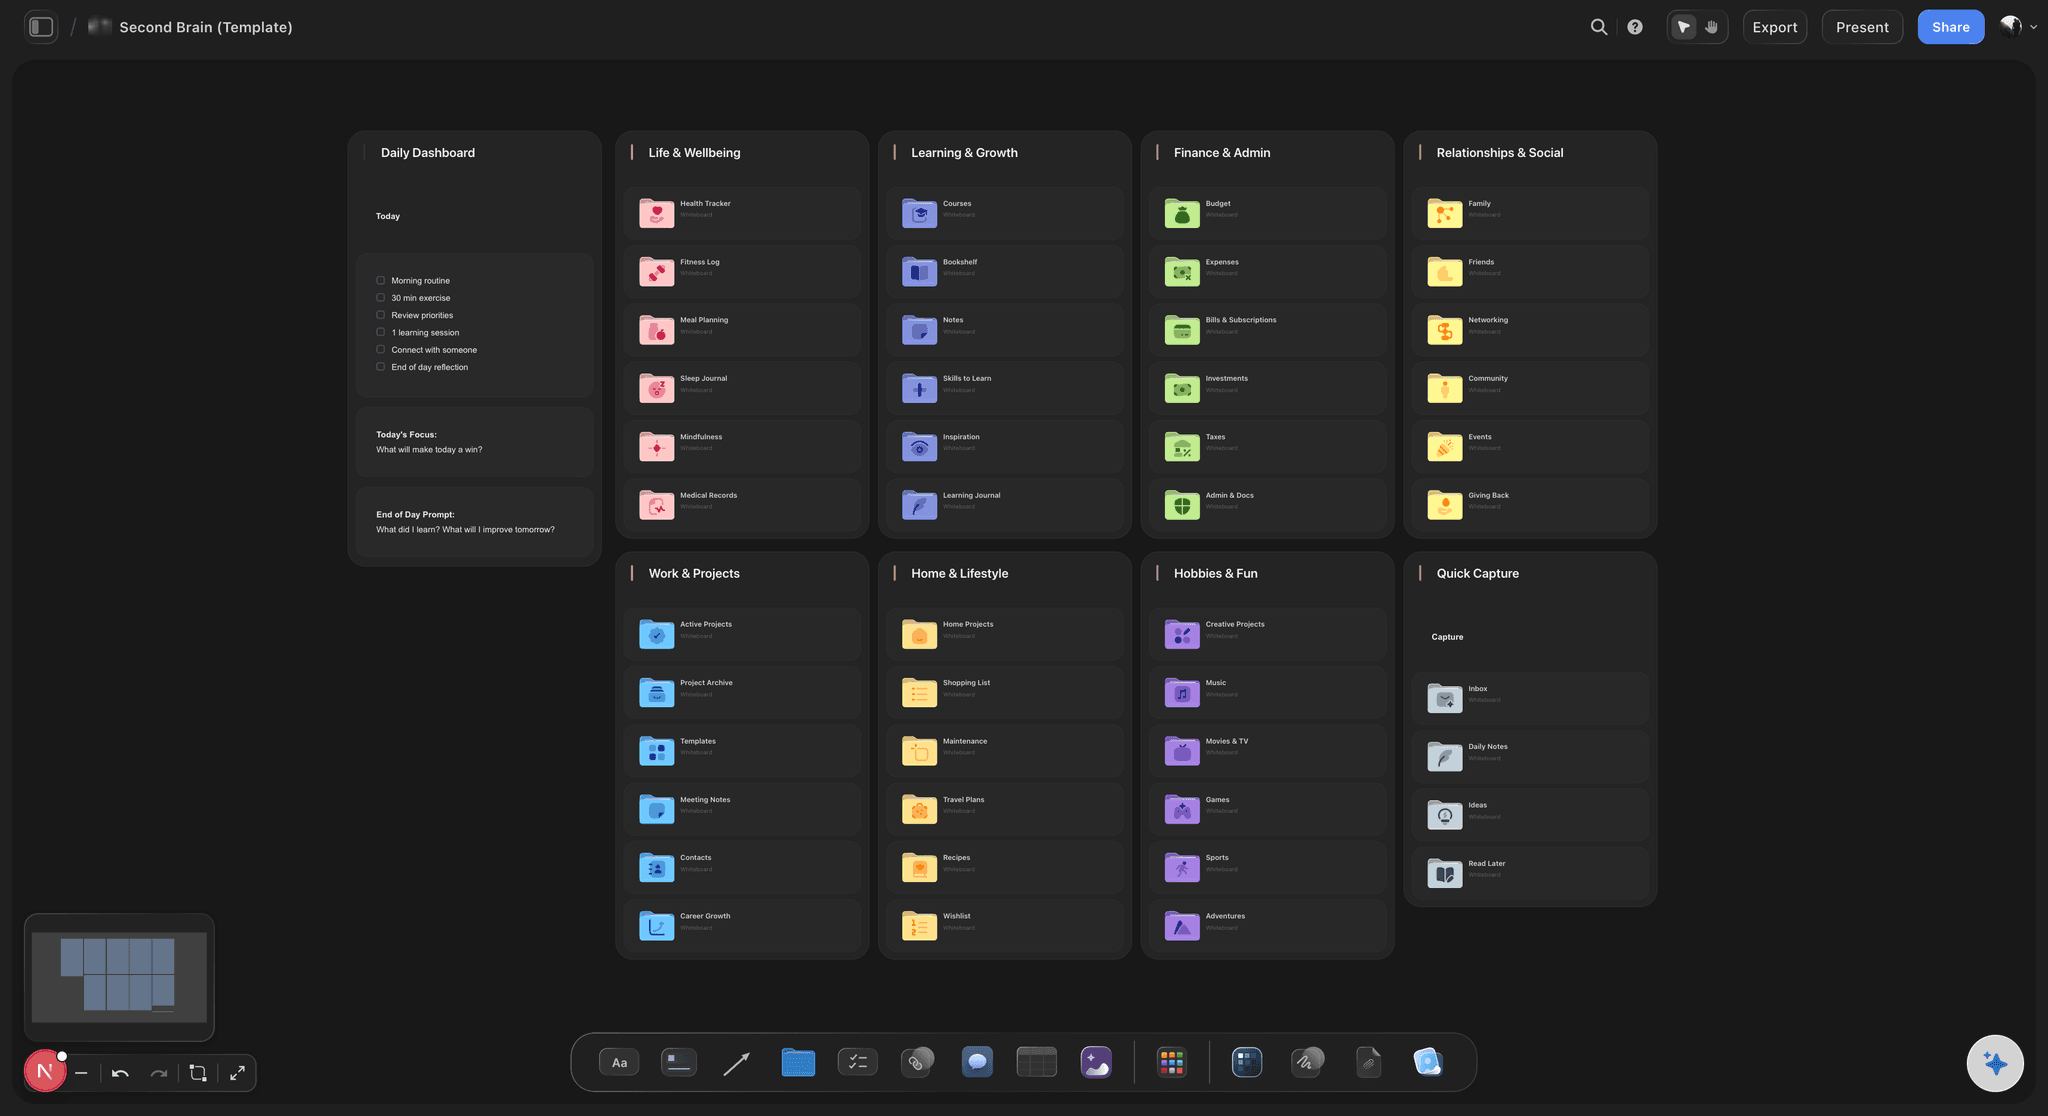
Every edge says what kind of relationship it is
Typed edges, not just lines
Contradicts, replicates, depends on, is an example of, was superseded by. An untyped graph is a picture; a typed one is a structure you can reason with.
Explore the concept map maker →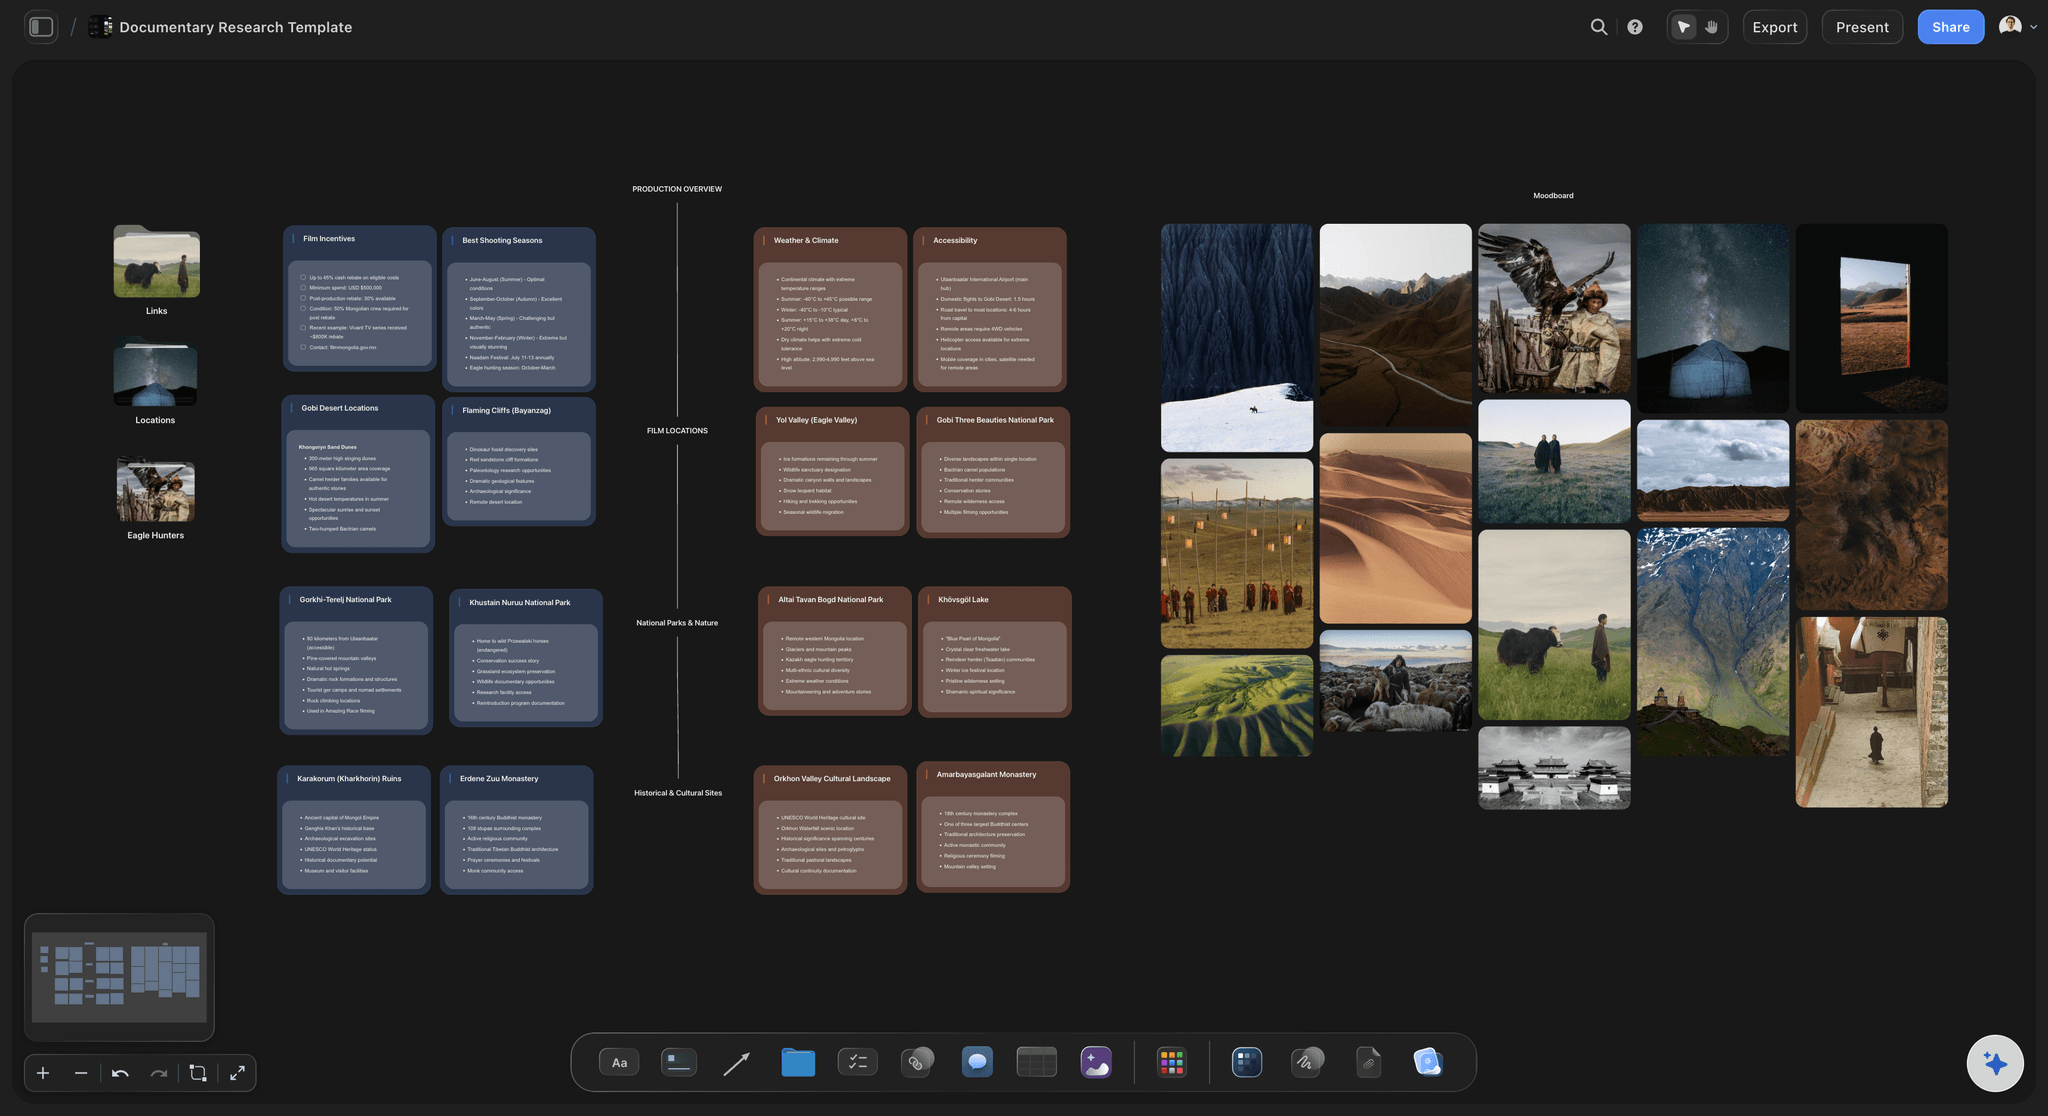
The source sits on the node it supports
Keep the evidence attached
Pin the PDF, the quote, the link, or the video frame to the node it justifies. A claim you can trace back to its source in one click is a claim you can still defend a year later.
See the research organizer →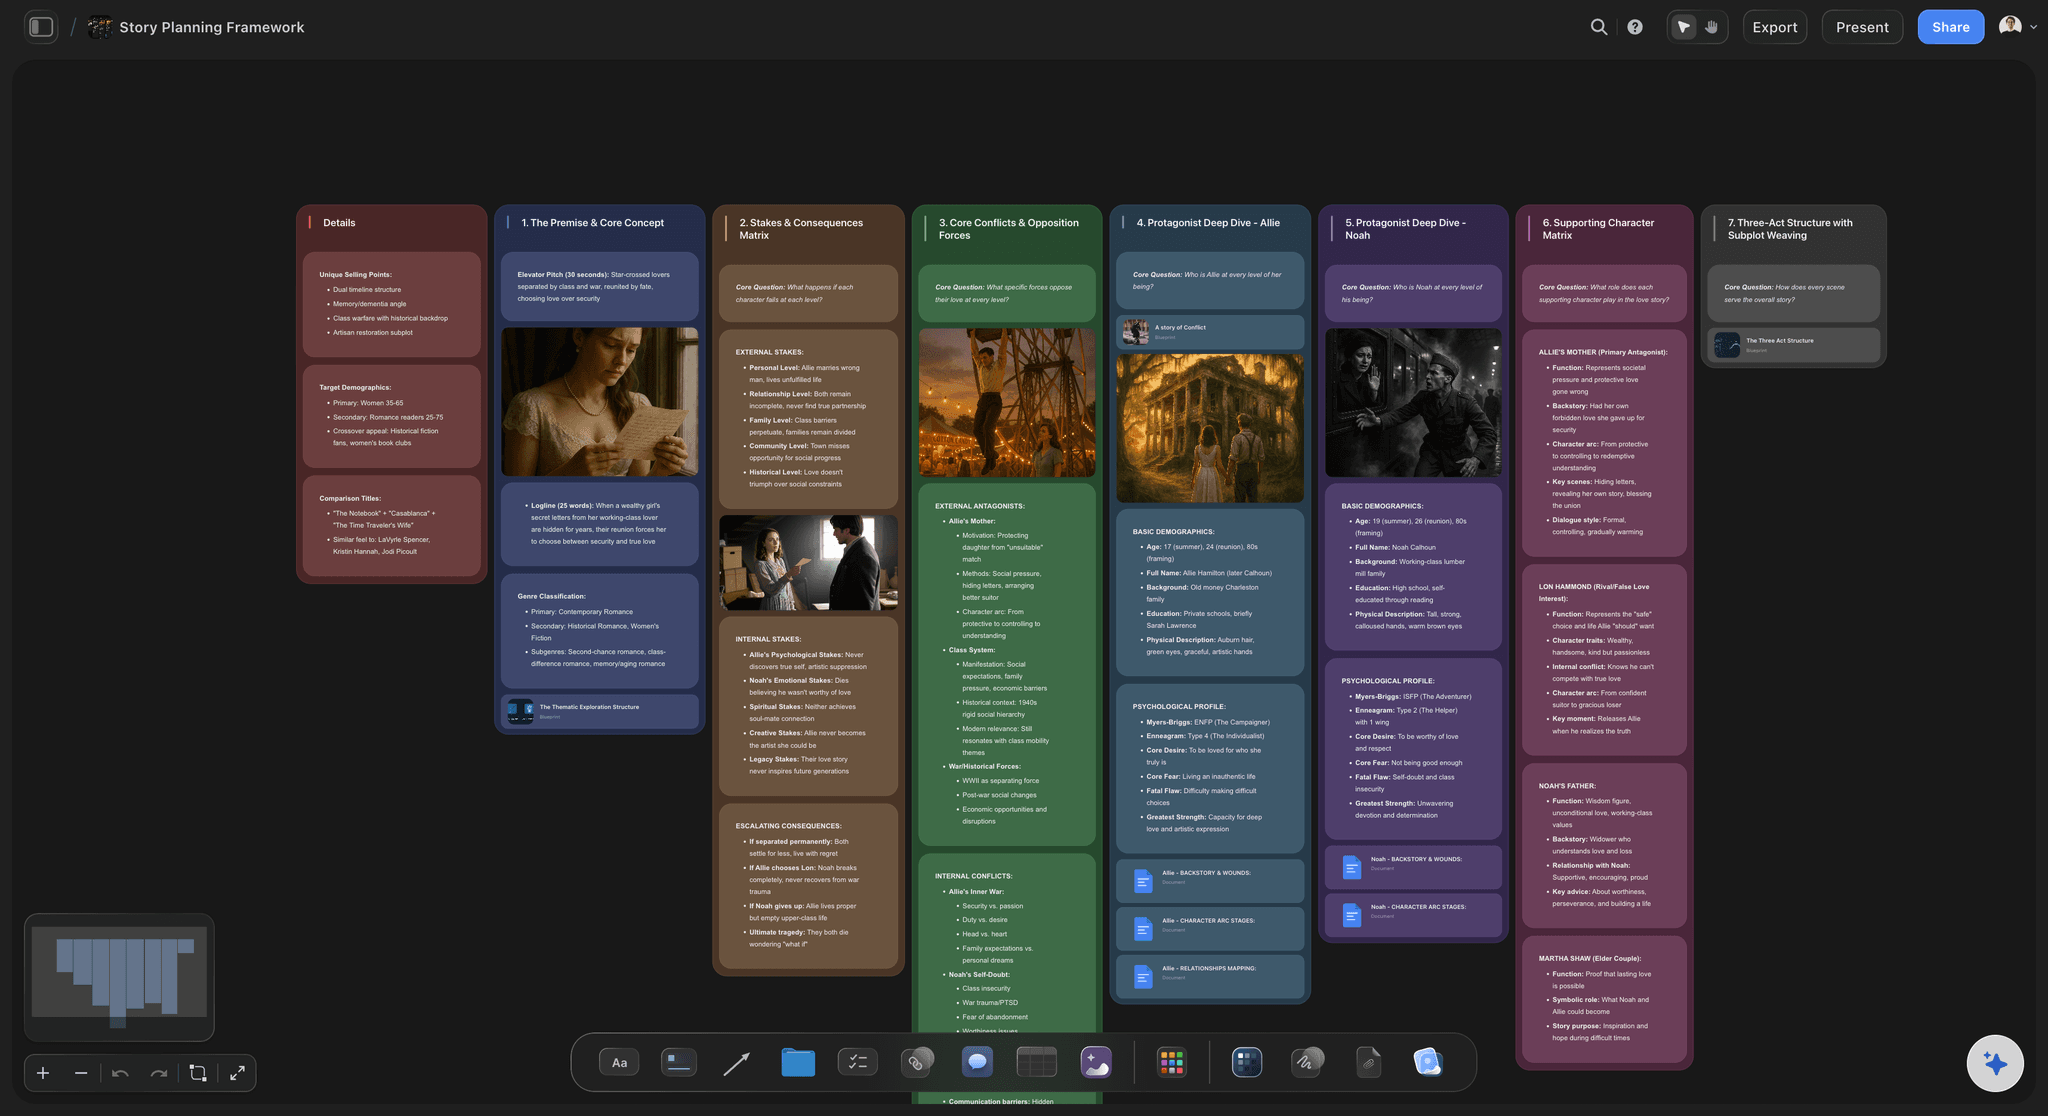
Absence is visible as empty space
Find the thin node before someone else does
A concept resting on one source, a cluster connected to nothing, a claim with no evidence attached. These are the questions a search box will never surface for you.
Try the second brain →Unlimited boards. No object cap.
Open a canvas, describe the subject, and let AI lay out the first network. Storyflow is paid-only during early access, with plans from $7.99 a month billed annually, and a Free plan launches before the end of 2026.
Unlimited graphs on an infinite canvas with no node cap
Basic AI usage to extract entities and propose connections
Starter templates for research, mind maps, and second brains
Share view-only links with collaborators, no account required
Built for people with taste
A folder tells you where a thing is. A graph tells you what it means.
Storage was never the hard part. The hard part is noticing what your knowledge is missing.
The edges carry the meaning
Type the relationship, not just the link
Support and contradiction: Two sources agreeing and two sources disagreeing look identical in an untyped graph, which is the single largest loss. Labeling them separately turns your notes into something you can argue from.
Dependency: Mark which claims rest on which. When one source turns out to be wrong, the graph shows you immediately what else you now have to revisit, which is otherwise a memory exercise you will fail.
Direction: Influence, citation, and causation all run one way. An arrow costs nothing to draw and preserves a distinction that a plain line destroys.
Time and supersession: Mark what replaced what. A graph that does not record supersession quietly keeps outdated understanding at the same weight as current understanding, which is worse than not recording it at all.
AI that reads the whole canvas as context
Ask the graph what you have missed
Extract entities from your material: Drop in notes and sources and the AI identifies the people, concepts, and claims and lays them out with candidate edges. It is a first pass to correct, not an answer.
Interrogate the structure: Ask which nodes rest on a single source, which two clusters have no connection despite being about the same thing, or what a missing edge between two concepts might be. The AI uses your whole board, so the answers are about your work.
It proposes, you decide: Storyflow structures and suggests; whether two ideas genuinely contradict each other is a judgment only you can make, and it is the judgment that makes the graph worth having.
Grow it without rebuilding it: Add a new source and ask the AI to place it. Nodes you have positioned and edges you have labeled stay exactly where they are.
Text, PDFs, images, and video on the same surface
Keep the raw material on the graph
Sources attached to nodes: Pin the paper, the interview transcript, the screenshot, or the dataset directly to the concept it supports, so the graph is navigable back to primary material rather than being a layer of abstraction over a folder you still have to search.
Quotes at the point of use: Put the actual sentence on the edge that claims a source supports something. Paraphrase drift is how a literature review ends up asserting things nobody wrote.
Video and web reference: Grab frames from YouTube or Vimeo, paste links and screenshots, and keep them beside the node they inform rather than in a bookmarks folder nobody revisits.
One graph a group can build together
Shared understanding, actually shared
Collaborators on one canvas: A research group, a reading group, or a team onboarding someone new can build one graph rather than several private ones that quietly disagree.
View-only links for readers: Send a link and anyone opens the whole graph in a browser with no account, which makes the structure of an argument something you can hand to a supervisor or a colleague directly.
Comments on the node in question: A disagreement about whether two findings actually conflict belongs on the edge between them, not in a separate thread that loses its referent within a week.
Explore templates for your project
Every template opens as a real, editable board on the infinite canvas. Pick the closest fit and make it your own.
Mind Map
Branch one central idea out into themes and sub-points, then drag the connections around until the structure makes sense.
One app instead of five
Storyflow vs Obsidian, Roam, and Neo4j.
These solve genuinely different versions of the problem: Obsidian is excellent for local, plain-text linked notes, Roam pioneered the outliner with bidirectional links, and Neo4j is a real graph database for querying at scale. Here is where they differ.
Storyflow
Recommended
Freeform spatial layout you arrange by hand
AI extracts entities and proposes connections
Labeled, typed relationships between nodes
PDFs, images, and video attached to nodes
Local plain-text files you own on disk
Query language for large-scale graph queries
Obsidian
Freeform spatial layout you arrange by hand
AI extracts entities and proposes connections
Labeled, typed relationships between nodes
PDFs, images, and video attached to nodes
Local plain-text files you own on disk
Query language for large-scale graph queries
Roam Research
Freeform spatial layout you arrange by hand
AI extracts entities and proposes connections
Labeled, typed relationships between nodes
PDFs, images, and video attached to nodes
Local plain-text files you own on disk
Query language for large-scale graph queries
Neo4j
Freeform spatial layout you arrange by hand
AI extracts entities and proposes connections
Labeled, typed relationships between nodes
PDFs, images, and video attached to nodes
Local plain-text files you own on disk
Query language for large-scale graph queries
What creators are saying
Join early creators getting structured workspaces and AI that remembers their projects
“Storyflow has sped up my workflow by at least 3x, which means more flow state and more projects I can actually ship. It truly changed the way me and my team create.”

Reilin Joey
Director & YouTuber
“One prompt gets me a structured board. But the tactics are my favorite. I run my YouTube scripts through them and my intros and retention got better. It's amazing.”

Justkay
YouTuber & Freelance Filmmaker
“I used to juggle five apps to plan a project. Now I describe what I am making and get boards, lists, and a schedule. All in one place.”

George
@fernwehchronicles
Knowledge graph questions, answered.
What one is, how to build a useful one, and where the limits are.
A knowledge graph stores information as a network of entities and the labeled relationships between them, rather than as documents inside folders. The nodes are things: people, concepts, sources, events, claims. The edges say how each pair relates: cites, contradicts, depends on, is an example of, was influenced by. Google popularised the term for the structure behind its search results, and the same idea applied to personal or research knowledge is why several note tools offer a graph view. The argument for it is that the valuable part of what you know is usually relational, and a folder hierarchy forces every item into exactly one place while discarding everything about how it connects to the rest.
Storyflow is a canvas for a deliberate knowledge graph: notes, sources and concepts are nodes you arrange by hand, and the relationships between them are labeled and typed. PDFs, images and video stay attached to the nodes, and its AI extracts entities and proposes connections. Obsidian still keeps local plain-text files you own on disk, which Storyflow does not.
A mind map is a tree with one centre and branches radiating outward, which makes it excellent for exploring one topic quickly and unable to express a relationship between two branches. A knowledge graph is a network: any node can connect to any other, connections carry labels, and there is no privileged centre. In practice mind maps are for generating and graphs are for organising what you have generated. Many projects use both, starting with a mind map when the subject is new and moving to a graph once there is enough material that the cross-connections matter more than the branching structure. On an infinite canvas you can keep both on the same board and let one grow out of the other.
Start with your material rather than with a schema, because a schema designed in advance is almost always wrong and it stops you before you begin. List the entities that keep coming up, put each on a node, and then do the actual work, which is connecting pairs and labeling what the connection is. Resist the temptation to connect everything: a graph where every node touches every other carries no information, and the discipline is including an edge only when the relationship does work. Then read the result for absence, which is what the exercise is really for. Nodes with one source, clusters that connect to nothing, and claims with no evidence attached are the findings, and each one is either a gap to fill or a deliberate boundary.
Typed edges, attached sources, and the willingness to leave gaps visible. Untyped graphs are the most common failure and they look impressive: hundreds of nodes and a dense web of lines that all mean the same nonspecific thing, which is that two notes reference each other. That picture cannot answer a question. A graph where the edges say contradicts, replicates, or depends on can answer several, including the one that matters most, which is what breaks if this source turns out to be wrong. The second requirement is that nodes carry their evidence, because a graph you cannot trace back to primary material becomes a set of assertions you have to take on trust from your past self. The third is not smoothing over the holes.
PKM stands for personal knowledge management: the practice of capturing, organising, connecting, and retrieving what you learn so it stays usable rather than accumulating. It covers note-taking, but the note-taking part is the easy half and the one every tool solves. The hard half is connection and return, and the common outcome of a mature PKM system is several hundred well-tagged notes that their owner has not opened since writing them, because search only answers questions you already know to ask. A knowledge graph is one answer to that: store the relationships between ideas explicitly, so the structure itself tells you which claim rests on one source and which two clusters are about the same thing without knowing it. Popular PKM tools include Obsidian, Roam, and Notion, and the practice matters more than the tool.
Not during early access. Storyflow is paid-only right now, with plans from $7.99 a month billed annually, and a Free plan launches before the end of 2026. Anyone a paid member invites to a board joins free today, so a research group or a co-author can view and contribute without paying. If you need a free option now, Obsidian is genuinely free for local use and its graph view is good, with the caveat that its edges are untyped. For a real graph database with a query language, Neo4j has a free tier. Storyflow occupies the informal middle: no schema to design, no query language to learn, spatial arrangement you control by hand, and an AI that produces the first pass.
It can do the extraction and the first arrangement, which is the tedious part, and it should not be trusted with the judgments. Given a body of material, the AI will identify the recurring entities, lay them out, and propose connections, which turns hours of node creation into something you spend your time correcting instead. That correction is not overhead, it is where the understanding happens: deciding that two findings genuinely contradict rather than merely differ, or that one claim depends on another, is the actual intellectual work and it is not delegable. The specific thing to watch for is the AI over-connecting, since a model asked to find relationships will find them, and a graph with too many weak edges is less useful than one with fewer strong ones. Prune aggressively.
On a fixed page, around forty nodes before the edges become spaghetti. On an infinite canvas the practical limit is much higher because you can use space instead of compressing: give each cluster its own region with internal edges drawn inside it, and only draw cross-cluster edges that carry real weight. Beyond a few hundred nodes the right move is not a bigger picture but a layered one, with a top-level map of clusters and detailed graphs in their own regions. The skill throughout is curation rather than completeness. A graph that includes every relationship you could justify hides the dozen that matter, and the point of drawing it was to make those dozen visible.
It is arguably the best use for one, because a literature review is a graph that convention forces into prose. Put each paper on a node with its finding, and label the edges honestly: replicates, contradicts, uses the same method on a different population, was superseded by. Three things surface almost immediately and are painful to find any other way. Clusters of papers that all cite one original study, which tells you the field rests on a narrower base than the citation count suggests. Contradictions nobody has reconciled, which is often where the contribution is. And your own claims that no paper on the board actually supports. Write the prose afterwards, from the graph, and export it as an image or PDF for a supervisor.
Yes, and shared construction is where graphs earn their keep. Invite people onto the canvas and a research group, a team, or a pair of co-authors builds one graph instead of several private ones that quietly disagree with each other, which is the normal state of affairs and is only discovered at a late and expensive moment. Send a view-only link and anyone opens the whole graph in a browser with no account, which makes it possible to hand the structure of an argument to a supervisor or a colleague rather than describing it. Comments attach to the node or edge they concern, so a disagreement about whether two findings actually conflict stays on the edge between them.
A second brain is a whole personal knowledge practice, covering capture, organisation, retrieval, and review, and it is largely about making sure things you encounter are findable later. A knowledge graph is one structure inside that practice, and it addresses the part most second-brain systems handle worst, which is connection. The common experience of a mature note collection is hundreds of well captured, well tagged notes that are never revisited, because capture and retrieval were solved and synthesis was not. A graph is the synthesis step: deciding what relates to what and why, which is slower than capture and is the only part that produces new understanding rather than storage. In Storyflow both can live on the same canvas.
Find out what your knowledge is missing.
Open a canvas, describe the subject, and let AI lay out the first network. No download.