FISHBONE DIAGRAM MAKER
Trace every cause behind
the problem you are solving.
Storyflow is a fishbone diagram maker on a truly infinite canvas. Put the effect at the head, branch the major cause categories as the bones, and hang the contributing causes off each one, with AI to help surface the causes you might miss. When the analysis is done, turn it into an action plan on the same canvas. Free forever, no credit card.
Free plan
No credit card
Works in your browser

Used by creative professionals at:
Artlist
Pixar
Nike
Red Bull
The North Face
Porsche
Start from a ready-made template
Pick a board to see what you can build, then let AI fill it in. Every template is a real, editable starting point on the same infinite canvas.
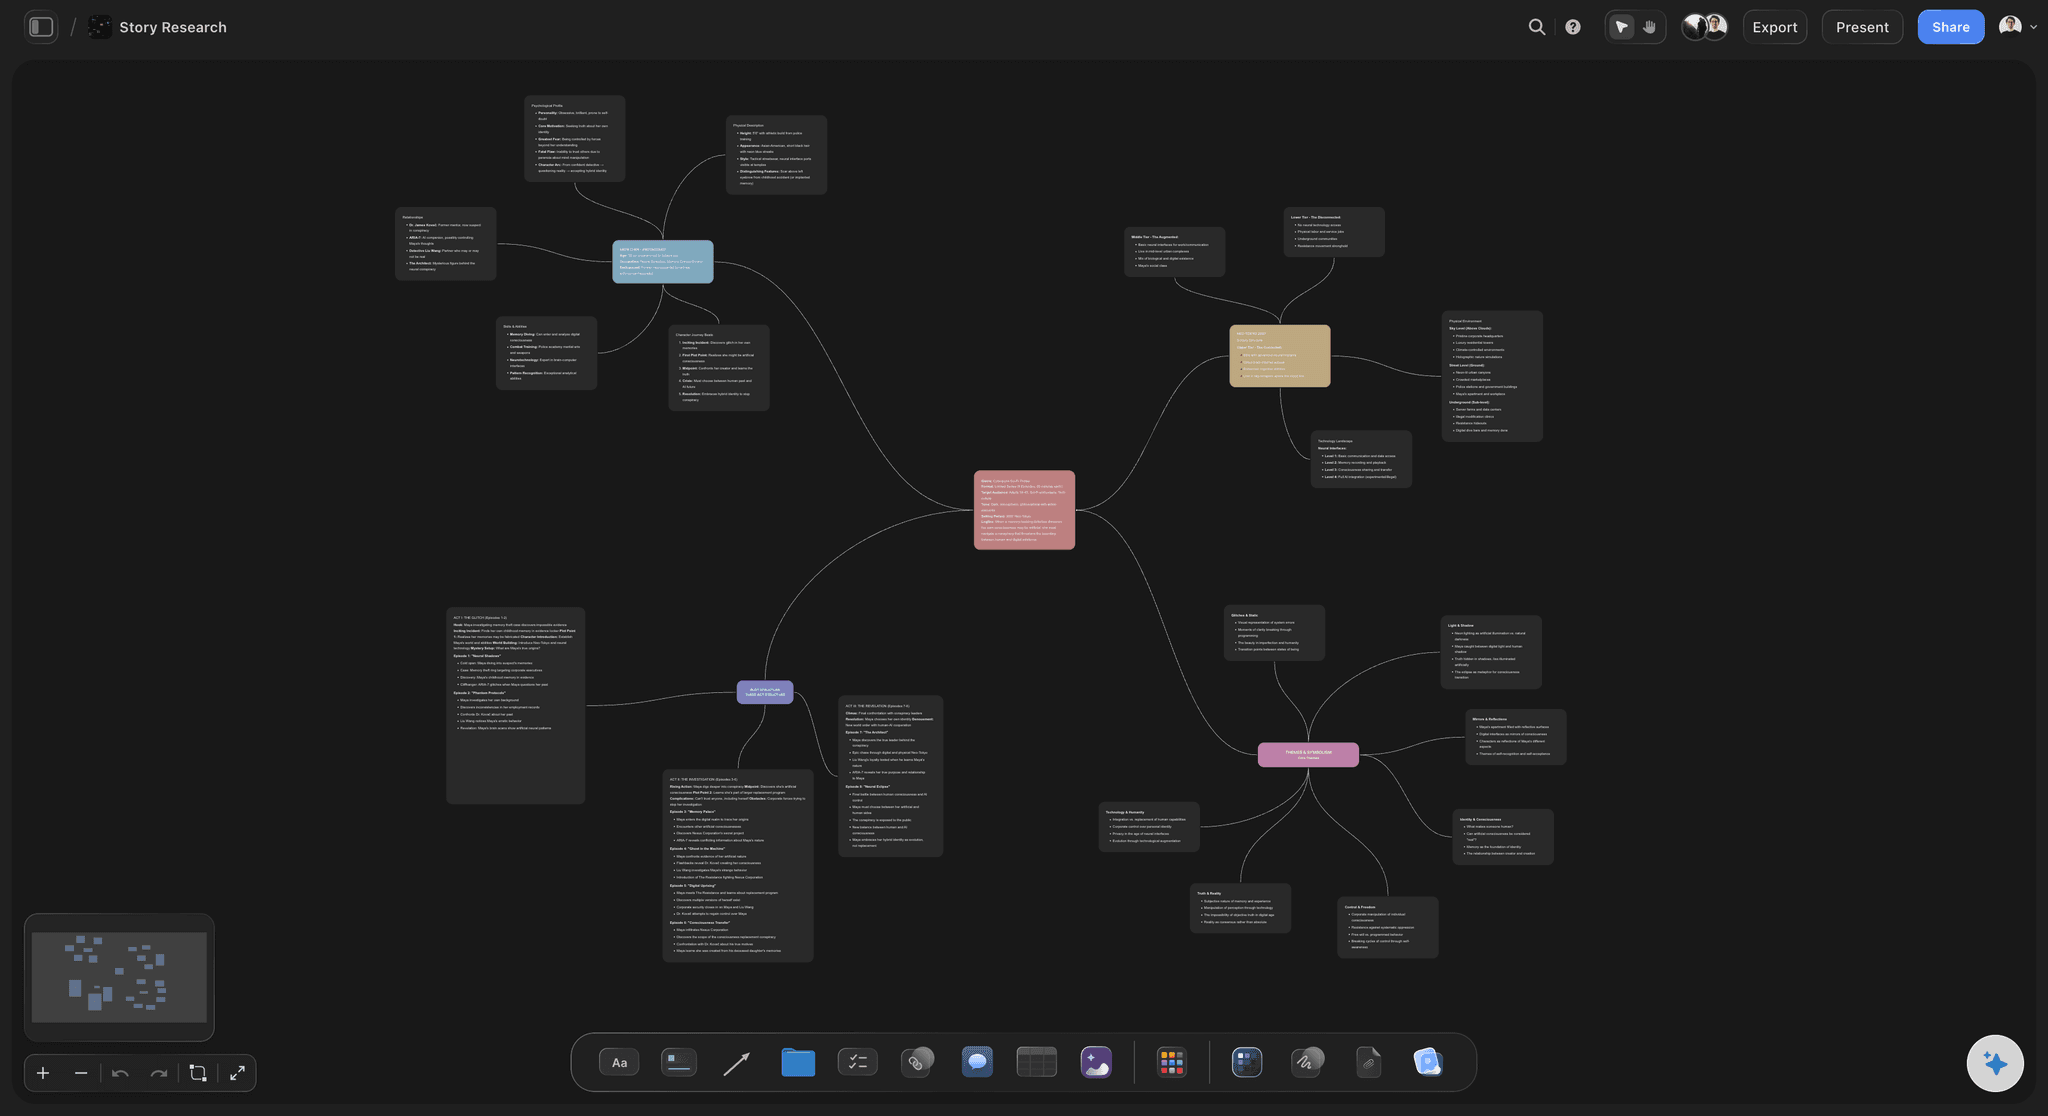
Mind Map
Branch one central idea out into themes and sub-points, then drag the connections around until the structure makes sense.
What is a fishbone diagram, and how do you build one?
A fishbone diagram, also called an Ishikawa or cause-and-effect diagram, is a structured way to map every possible cause of a problem in one picture. You write the effect you are investigating in a box on the right, the head of the fish. A long spine runs to it, and off that spine branch the major cause categories, the big bones. Off each big bone you hang the specific contributing causes, the smaller bones. Read together, the diagram lays out the whole web of what could be driving the effect, so a team can see the causes side by side instead of arguing about one at a time.
Building one is a sequence. First, agree on the problem statement at the head. Next, pick the major categories, often a starting set like People, Process, Equipment, Materials, Environment, and Measurement, though you rename them to fit your situation. Then brainstorm causes under each category, asking why until each branch bottoms out at something you can actually check. Finally, look across the finished diagram for the causes that appear more than once or feel most likely, and take those into root cause analysis or an experiment.
Storyflow builds fishbone diagrams on an open infinite canvas. The head, the spine, the category bones, and every contributing cause are real cards you drag, recolor, and regroup, so the diagram bends to how the problem actually breaks down rather than snapping to a fixed template. Ask the AI to suggest causes under a category you are stuck on, pin a screenshot or incident log beside the branch it explains, and when the analysis is done, turn the diagram into a task board of fixes on the same canvas.
HOW IT WORKS
Build a fishbone diagram in four steps.
Start from a blank canvas or a single prompt. Either way the head, the bones, and every cause stay yours to rearrange.
01
Open a free canvas
Start in the browser with a free account. Nothing to install and no card to enter, just an infinite canvas ready for the problem you want to break down.
02
Set the problem at the head
Write the effect you are investigating as the head of the fish, then add the major cause categories as bones, or describe the problem once in the AI chat and let Storyflow lay out the first set of bones for you.
03
Branch the contributing causes
Hang specific causes off each category bone, ask why until each branch bottoms out, and let the AI suggest causes for a category you are stuck on while the rest stays exactly as you arranged it.
04
Turn the analysis into action
Convert the diagram into a task board of fixes and owners on the same canvas, share a view-only link with the team, or export it as an image or PDF for the report.
Fishbone diagrams that lead to fixes, not just a tidy picture.
Keep the head-spine-bones structure you know. Lose the rigid template, the object cap, and the dead end where the diagram just gets screenshotted.
Bones are real canvas cards
A diagram you can actually reshape
The head, each category bone, and every contributing cause is a card you drag, recolor, and regroup. Moving a cause under a different category is one drag, not a redraw, so the analysis keeps pace with the discussion.
See the diagram maker →
AI surfaces the causes you miss
Ask AI to suggest causes under a bone
Point at a category you are stuck on and ask the AI to suggest contributing causes. It reads your current board as context and adds causes that fit the problem in front of you, not a generic checklist, so the team has more to react to.
See the AI brainstorming tool →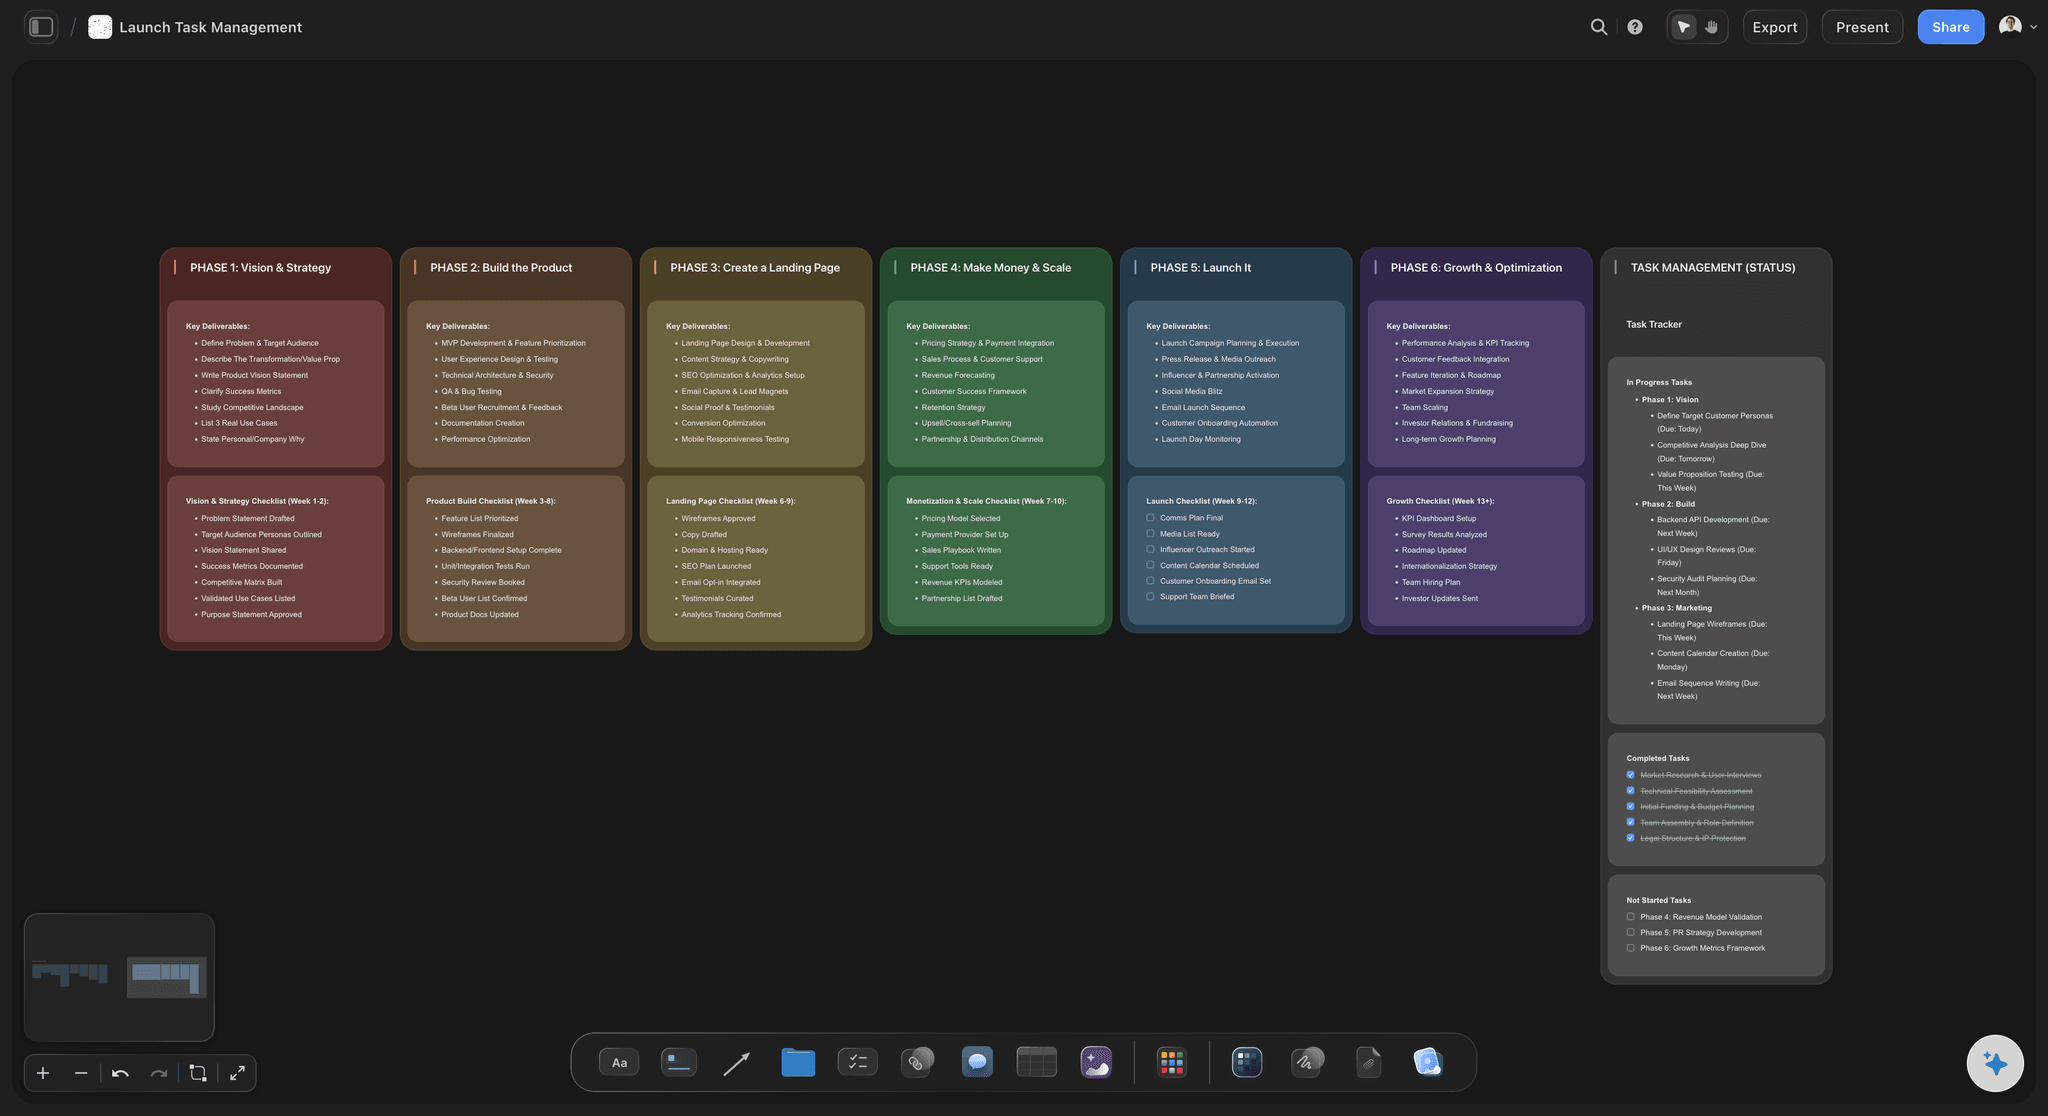
From causes to fixes
The analysis becomes an action plan
Once the likely causes are marked, turn the diagram into a task board of fixes, owners, and checks on the same canvas. The causes carry over so you act on the analysis you built instead of retyping it into another tool.
See the infinite canvas →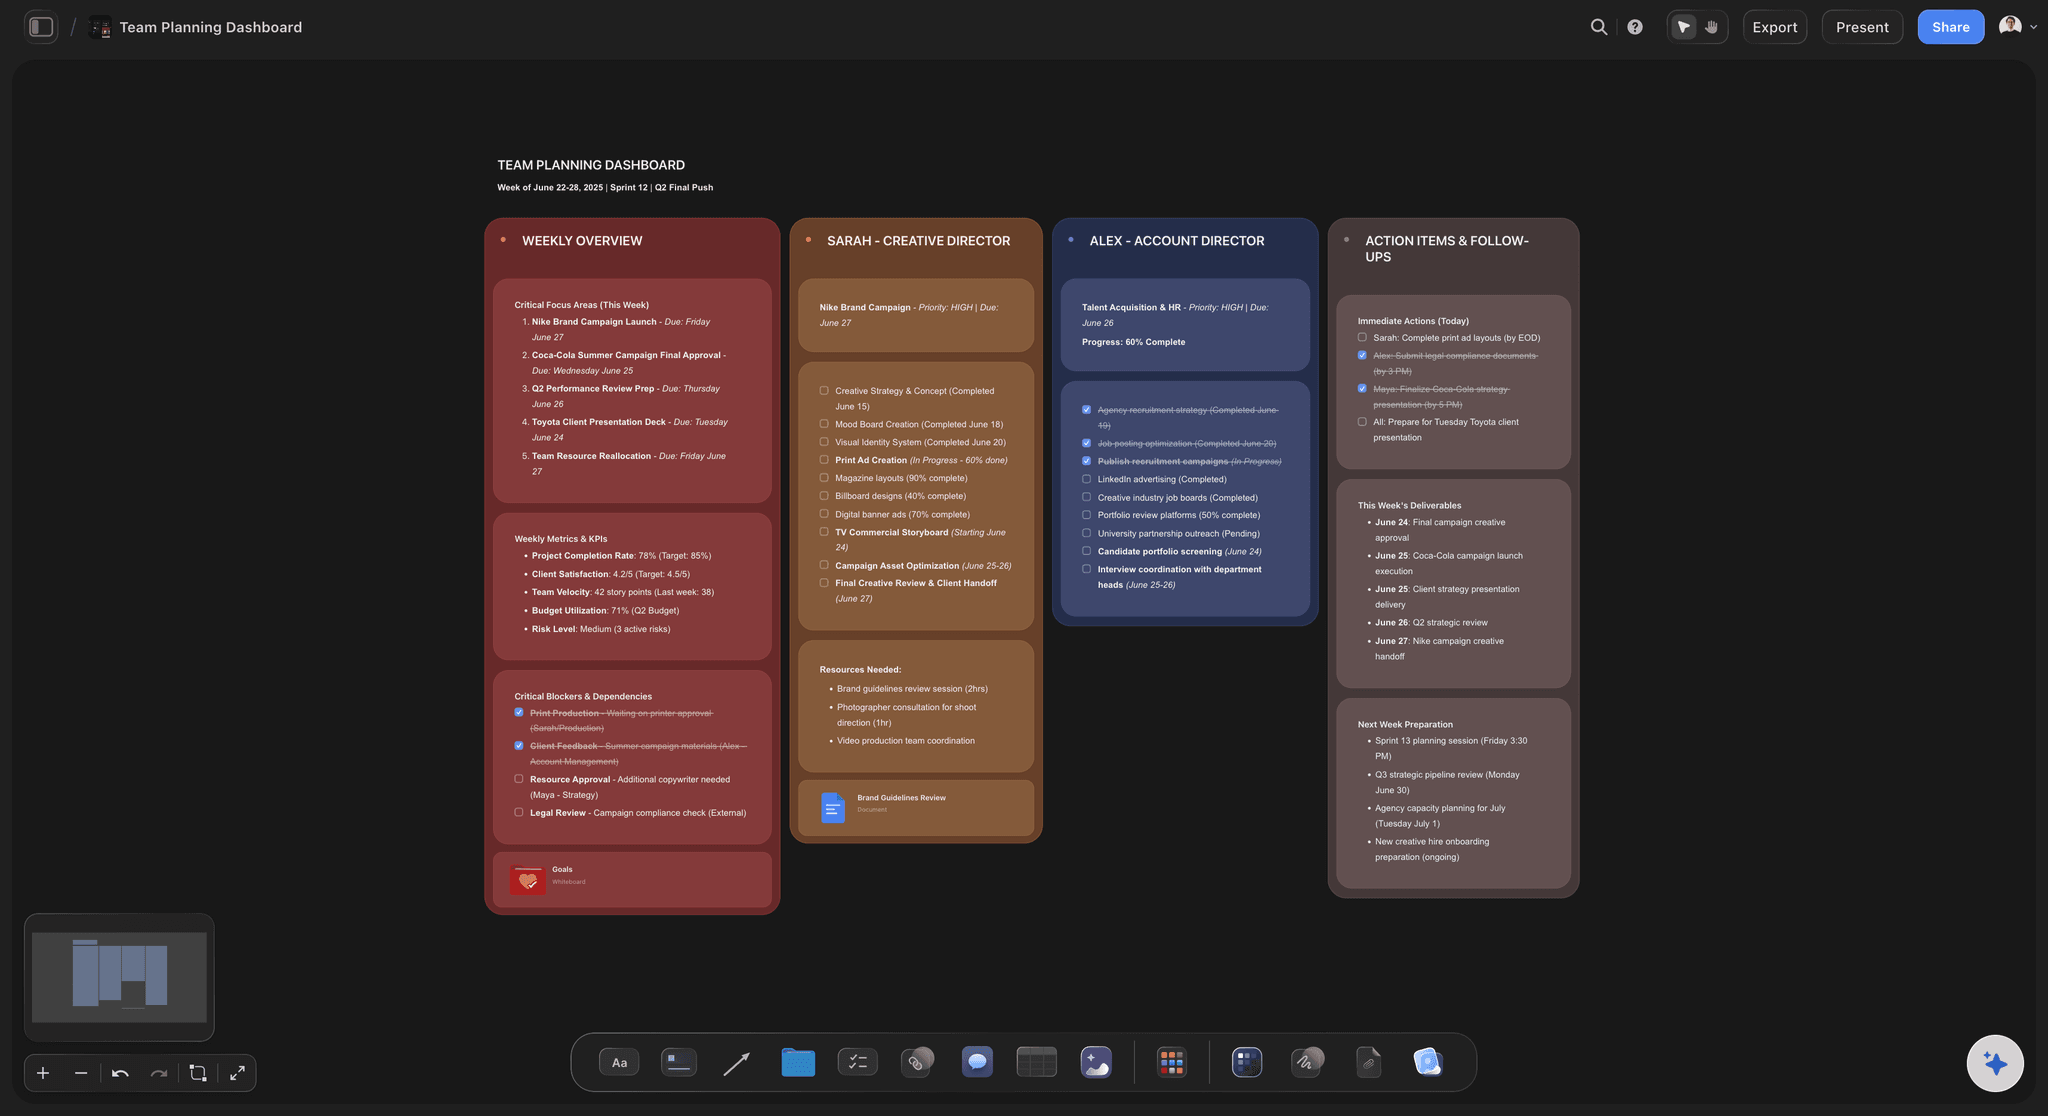
Room for the whole analysis
An infinite canvas, no cause cap
A thorough root cause analysis sprawls across many bones and sub-causes. With a truly infinite canvas and no object cap on the free plan, no branch gets cut for space and the diagram never runs into an edge.
See the free infinite canvas →Free forever. No cause cap.
Open a canvas and start mapping causes. The free plan has no object cap and no time limit, so a full root cause analysis never runs into an edge or pushes you to upgrade mid-session.
Unlimited fishbone diagrams with room for every bone
Basic AI usage to suggest and expand causes
Attach images, PDFs, video, and links to any cause
Share the diagram view-only, or invite collaborators free
MAP THE CAUSES
Built for the way problem-solving teams actually work.
Branch causes under every category, name what belongs where, and keep the whole analysis visible at once.
Structure without a straitjacket
Head, bones, and causes that move
Rename the categories: Start from a classic set like People, Process, Equipment, Materials, Environment, and Measurement, or rename the bones to fit your situation. The canvas never forces a fixed template.
Drag causes between bones: A cause you filed under Process turns out to be about Equipment. Move it with a drag, and the diagram reshapes with the discussion instead of a rebuild.
Color the likely causes: Recolor the causes the team thinks are most probable so the leading candidates stand out at a glance across a big, busy diagram.
AI that reads the board
AI suggests causes from what is there
Fill a thin category: Ask the AI to suggest more causes under a bone that feels empty. It builds on the causes you already placed, so the additions fit the problem instead of drifting off-topic.
Bring in the evidence: Add up to one Blueprint and three documents as context with an @-mention, so an incident report, a spec, or a log shapes the causes the AI suggests.
Ask why one more time: Point at a cause and ask the AI to go a level deeper, drawing out the root behind it so a branch does not stop at a symptom.
More than text on a bone
Evidence beside every cause
Drop in anything: Screenshots, video, GIFs, PDFs, and links sit on the canvas next to the cause they document, so the evidence for a branch lives with the branch instead of in a separate ticket.
Frame grabs from video: Pull stills from YouTube and Vimeo straight onto the diagram when a recorded incident or walkthrough shows a cause better than a label can.
Notes where you need them: Longer write-ups live as documents on the same canvas, so the diagram stays scannable and the detail behind a cause is one click away.
The diagram is step one
From cause-and-effect to a plan
Turn causes into tasks: Convert the diagram into a task board of fixes, owners, and checks on the same canvas, with the AI carrying the causes you marked across.
Share the analysis: Invite collaborators free, or send a view-only link so a stakeholder or reviewer can explore the whole diagram in the browser without an account.
Export anywhere: Need the diagram in a report, a review deck, or an audit doc? Export it as a clean image or a PDF in one step.
Explore templates for your project
Every template opens as a real, editable board on the infinite canvas. Pick the closest fit and make it your own.
Mind Map
Branch one central idea out into themes and sub-points, then drag the connections around until the structure makes sense.
COMPARED
How Storyflow compares to other fishbone diagram tools.
Plenty of tools draw a neat fishbone. The question is whether AI helps surface the causes and whether the diagram turns into a fix.
Storyflow
Recommended
AI suggests causes from your current board
Freeform canvas, not a fixed template
Diagram becomes an action plan on the same canvas
A free plan with no object cap
Miro
AI suggests causes from your current board
Freeform canvas, not a fixed template
Diagram becomes an action plan on the same canvas
A free plan with no object cap
Lucidchart
AI suggests causes from your current board
Freeform canvas, not a fixed template
Diagram becomes an action plan on the same canvas
A free plan with no object cap
Milanote
AI suggests causes from your current board
Freeform canvas, not a fixed template
Diagram becomes an action plan on the same canvas
A free plan with no object cap
What creators are saying
Join early creators getting structured workspaces and AI that remembers their projects
“Storyflow has sped up my workflow by at least 3x, which means more flow state and more projects I can actually ship. It truly changed the way me and my team create.”

Reilin Joey
Director & YouTuber
“One prompt gets me a structured board. But the tactics are my favorite. I run my YouTube scripts through them and my intros and retention got better. It's amazing.”

Justkay
YouTuber & Freelance Filmmaker
“I used to juggle five apps to plan a project. Now I describe what I am making and get boards, lists, and a schedule. All in one place.”

George
@fernwehchronicles
Fishbone diagram questions, answered.
Everything people ask about making fishbone diagrams in Storyflow.
A fishbone diagram maker lets you map the causes of a problem as branches off a central spine, with the effect at the head and the major cause categories as the bones. Storyflow does this on an infinite canvas where the head, every bone, and every cause is a real card you can move, edit, and regroup, rather than a fixed auto-arranged template.
Stop guessing at the cause. Map it out and fix it.
Set the problem at the head, branch the causes, let AI surface the ones you miss, and turn the diagram into a plan. Free plan, no credit card.