
GANTT CHART MAKER
Most Gantt charts are timelines.
Build one people will actually read.
The honest version first: Storyflow does not calculate critical path, does not level resources, does not auto-reschedule when a dependency slips, has no baseline versus actual tracking, and does not import MPP files. Microsoft Project, Smartsheet, and Primavera own that scheduling maths, and if you need it you should use them. What Storyflow does is the thing most teams actually want: a visual timeline of phases, milestones, and deliverables you build by dragging bars, with the real work attached to each bar instead of hidden behind a task ID. Paid-only during early access, plans from $9.99 a month, and a Free plan launches before the end of 2026.
Plans from $9.99/mo
Free plan coming late 2026
Works in your browser

Used by creative professionals at:
Artlist
Pixar
Nike
Red Bull
The North Face
Porsche
Start from a ready-made template
Pick a board to see what you can build, then let AI fill it in. Every template is a real, editable starting point on the same infinite canvas.
Mind Map
Branch one central idea out into themes and sub-points, then drag the connections around until the structure makes sense.
What is a Gantt chart, and which kind do you actually need?
A Gantt chart is a horizontal bar chart that maps a project against time: each bar is a piece of work, the bar's left edge is its start date, its right edge is its finish, and the whole set of bars is stacked so you can see at a glance what runs when and what overlaps with what. Henry Gantt popularised the form in the 1910s for industrial production scheduling, building on earlier work by Karol Adamiecki, and the shape has barely changed in a century because it is genuinely the clearest way to show duration and overlap on a single page. A Gantt chart maker is simply a tool that lets you build that picture without drawing rectangles by hand, and Storyflow is the visual kind: you place and drag bars on an infinite canvas, and the briefs, references, designs, and documents each bar depends on sit right there beside it.
The distinction that decides which tool you need is the one between a timeline and a schedule. A timeline is a communication artefact. It says: discovery runs through March, design overlaps the back half of it, build starts in April, and we present to the client on the 12th of May. It exists so a team, a client, or an executive can look at one image and understand the shape of the project. A schedule is a computation. It is a network of tasks with dependency types, durations, calendars, and resource assignments, and the software derives the finish date, identifies the critical path, and recalculates everything downstream when a task slips. Microsoft Project, Smartsheet, and Primavera are schedule engines. Storyflow is a timeline canvas. Most people searching for a Gantt chart maker want the timeline, and end up wrestling with a schedule engine because that is what the category is named after.
Here is what actually happens to most Gantt charts. Someone builds one in a spreadsheet with merged cells and conditional formatting, or spends a week configuring a heavyweight project management tool with task IDs, dependency links, and resource pools. It looks impressive in the kickoff deck. Then week three arrives, a deliverable moves, and updating the chart means opening a tool nobody else on the team has access to and re-linking a dependency chain. So it does not get updated. By week six it is actively lying to everyone who looks at it, which is worse than having no chart at all, because a stale plan is a plan people make decisions against. The reason is almost never laziness. It is that the chart lives somewhere separate from the work, so keeping it true is an extra job rather than a side effect of doing the project.
A project timeline worth maintaining has six named parts: phases, the broad stages the project moves through; tasks or workstreams, the bars of actual work inside each phase; milestones, the zero-duration moments that mark a decision, a delivery, or an approval; dependencies, the arrows or adjacencies showing what cannot start before something else finishes; owners, the person accountable for each bar; and deliverables, the concrete artefacts the timeline exists to produce. On an infinite canvas all six live in one view, and the deliverables are not just labels: the brief, the moodboard, the design files, the reference images, and the document sit attached to the bar they belong to, so the timeline is the project rather than a picture of it.
HOW IT WORKS
Lay out the timeline, attach the work, share the picture.
Four steps from a blank canvas to a timeline your team and your client can both read without a tutorial.
01
Open a canvas
Sign up in seconds, from $9.99 a month. Nothing to install, no project file to create, no dependency schema to define first. An infinite canvas opens in the browser, ready for the first rough shape of the project.
02
Describe the project
One sentence is enough: a product launch, a brand refresh, a six-week shoot, a course build. The AI reads the canvas as context and lays out phases, workstreams, and milestones as cards you can rearrange into a timeline.
03
Drag the bars into shape
Move things until the sequence is right. Stretch a phase, slide a deliverable later, stack the overlapping workstreams. Changing the plan is a drag, not a bulk edit across thirty linked rows in a schedule engine.
04
Attach the work and share it
Pin the brief, the references, the designs, and the documents onto the bars they belong to. Then send a view-only link that anyone opens in a browser, or export the board as an image or PDF for a deck.
A timeline that stays true because the work lives on it.
Not a scheduling engine. A visual planning surface where the chart and the project are the same object.
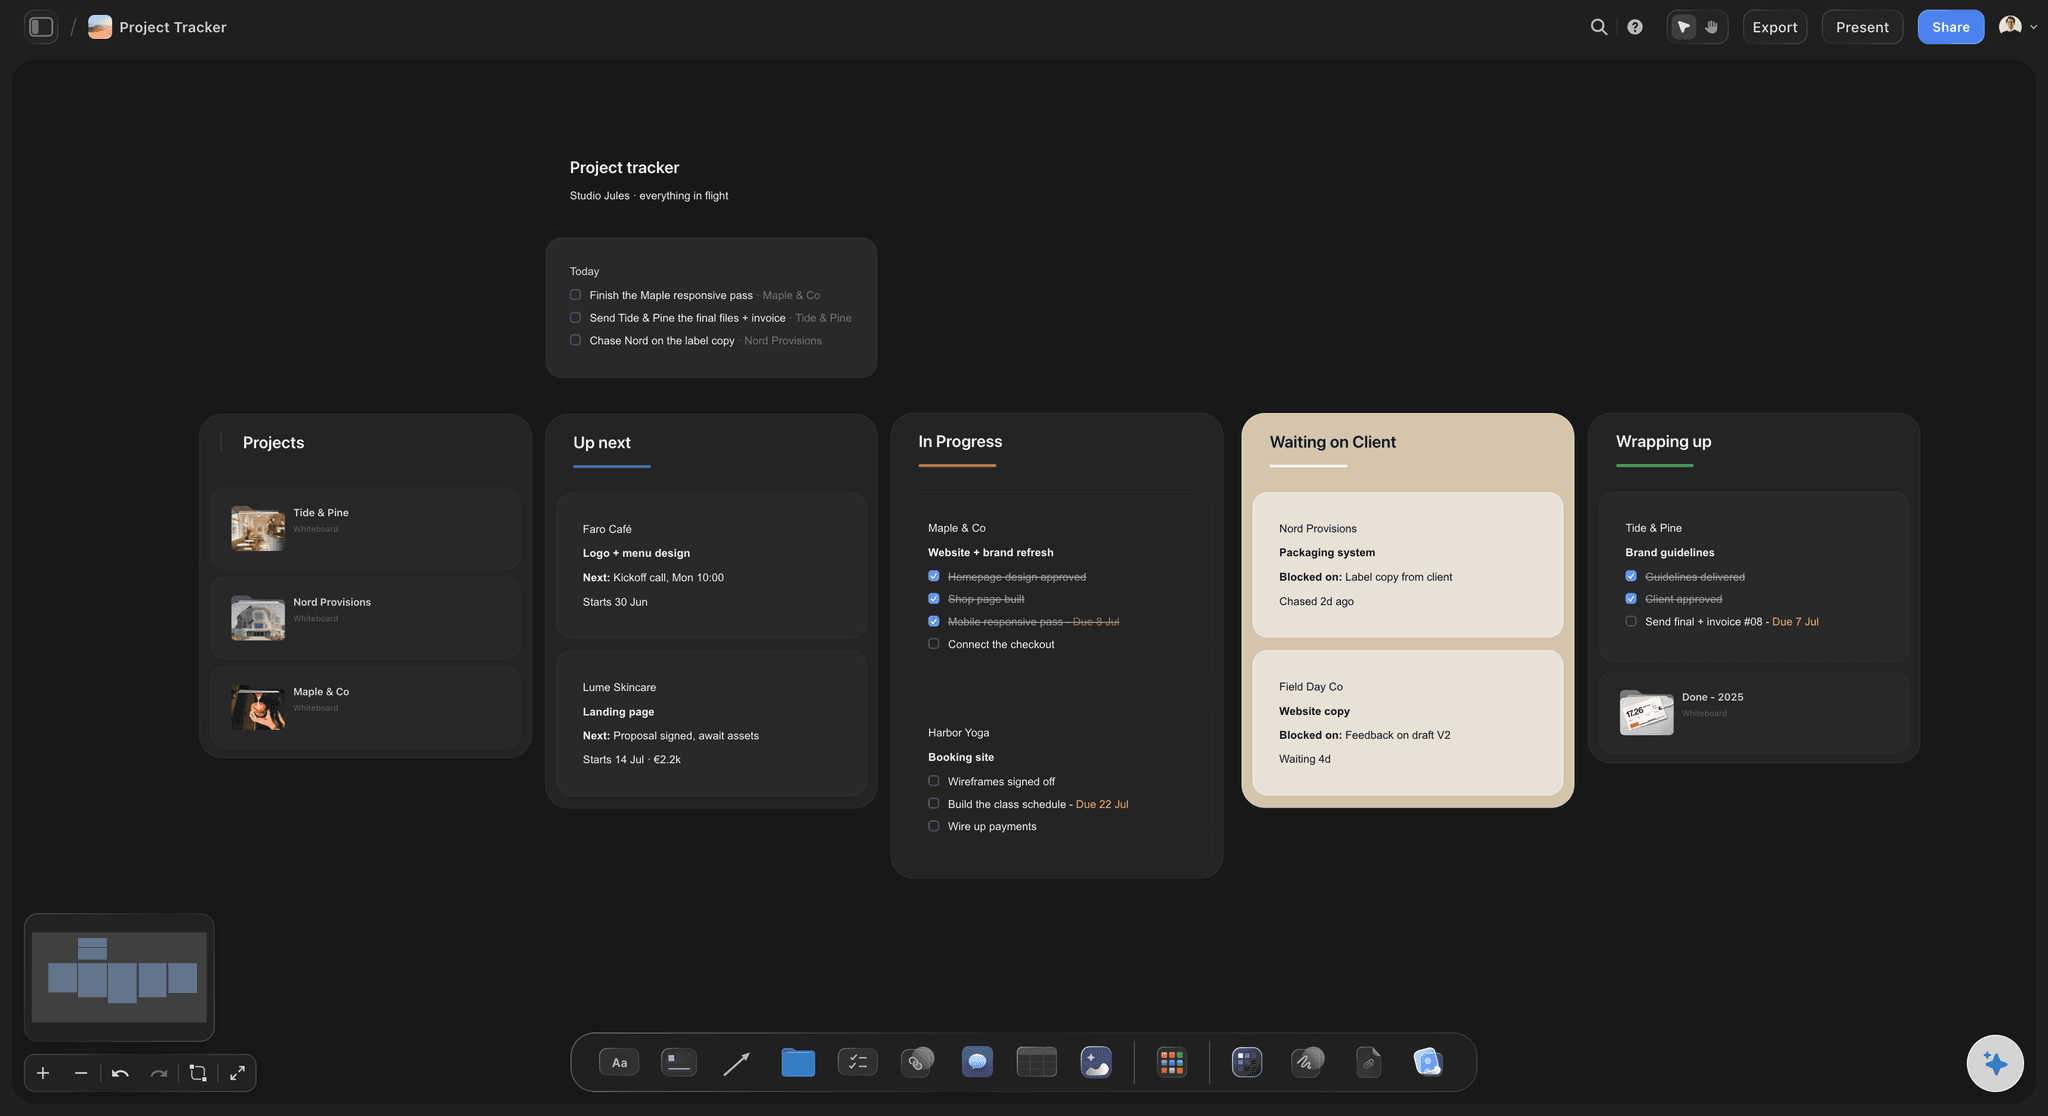
A full timeline from a single prompt
Start from a laid-out plan, not an empty grid
A blank Gantt tool is a grid of dates waiting for you to invent every task. Describe the project and Storyflow's AI places phases, workstreams, milestones, and open questions across the canvas, so you begin by dragging things into the right order rather than by typing rows.
See the timeline maker →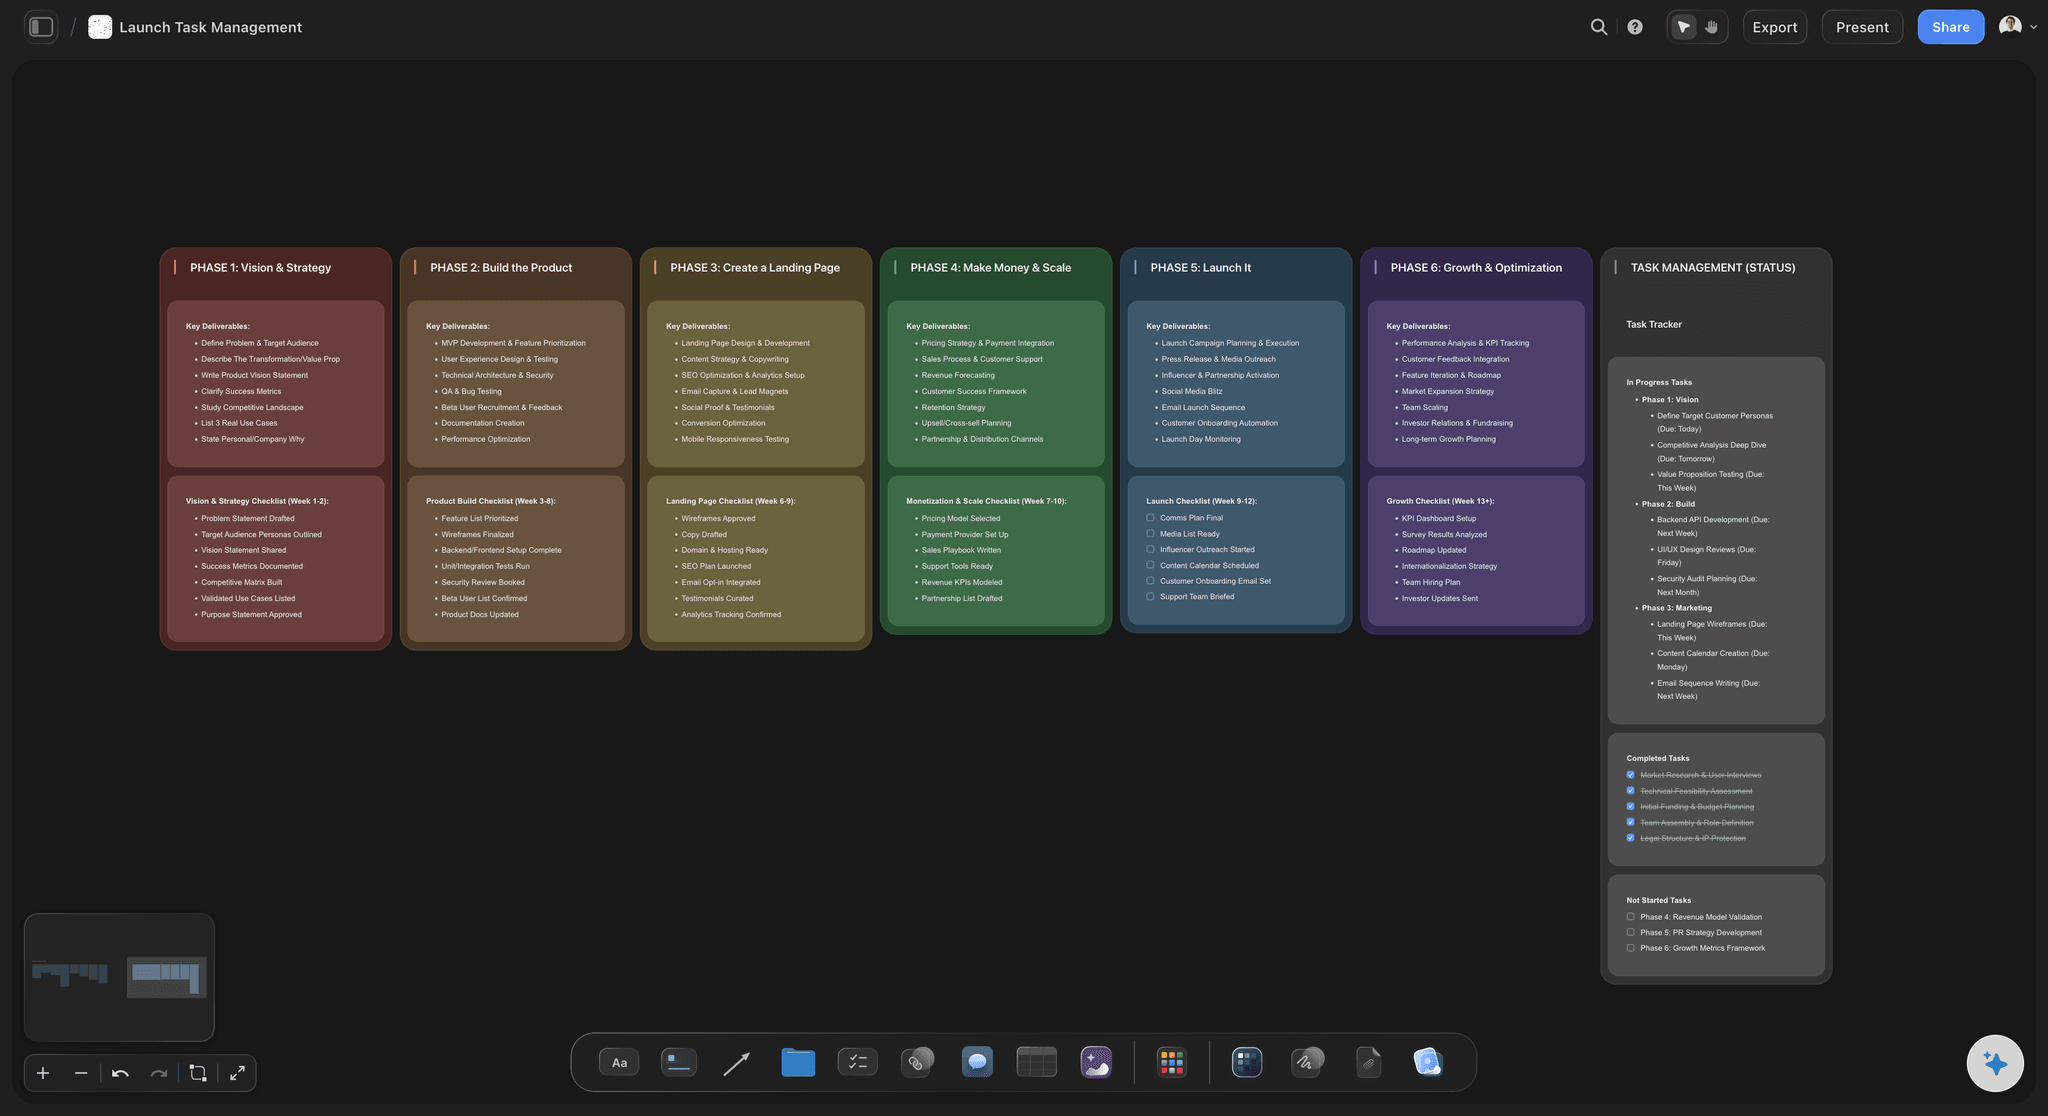
The deliverable, not just its name
Attach the actual work to the bar
In a traditional Gantt chart a deliverable is a task ID and a label, and the real thing lives in a folder somewhere else. Here the brief, the moodboard, the designs, the reference images, and the document sit on the canvas beside the bar, so opening the plan means seeing the work.
Explore the product roadmap board →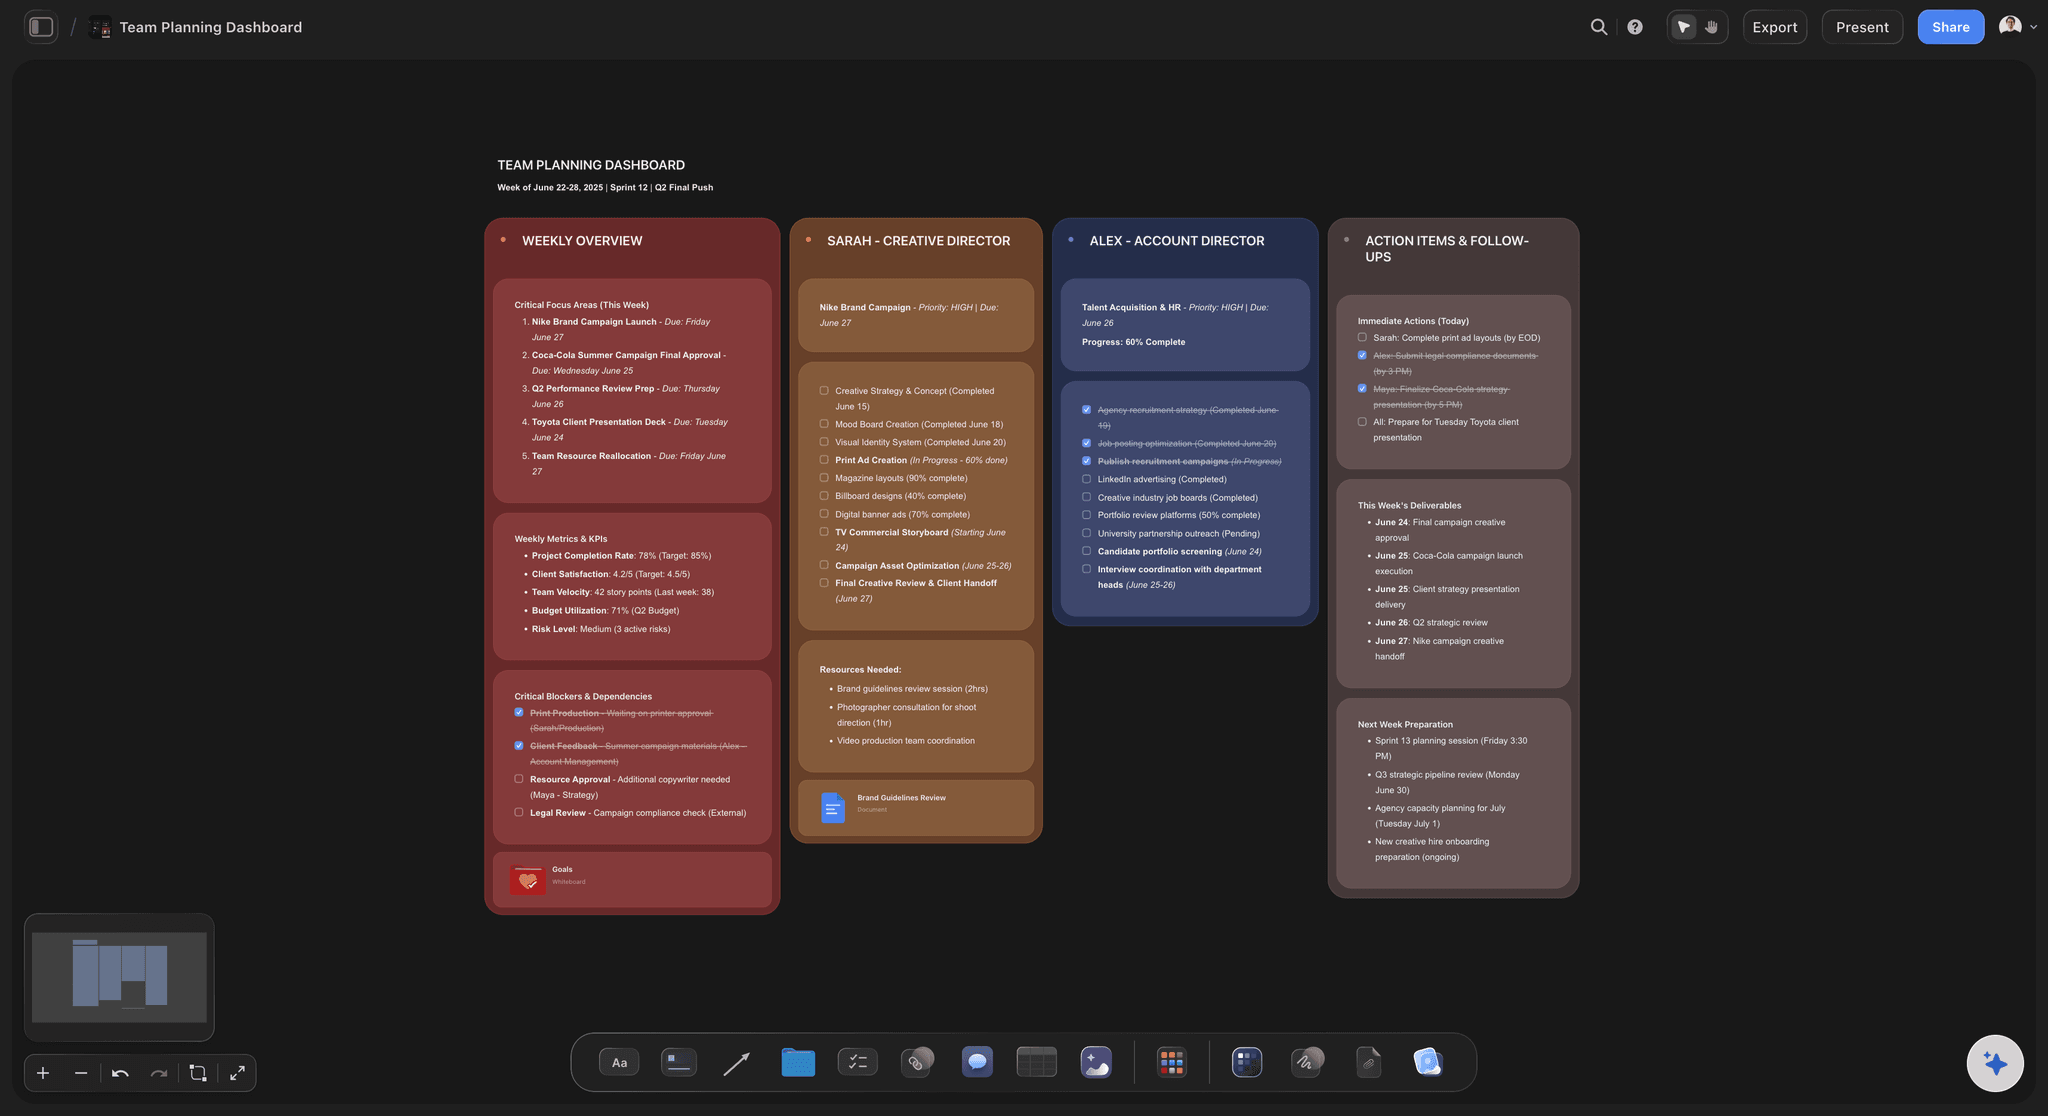
Nothing to configure before it is useful
No task IDs, no dependency schema, no admin
Configuring a proper schedule is a real skill and a real week of work, which is why so many teams give up and build the chart in a spreadsheet instead. A canvas has no setup step. You put bars on it and drag them, which is the entire onboarding.
Try the free timeline maker →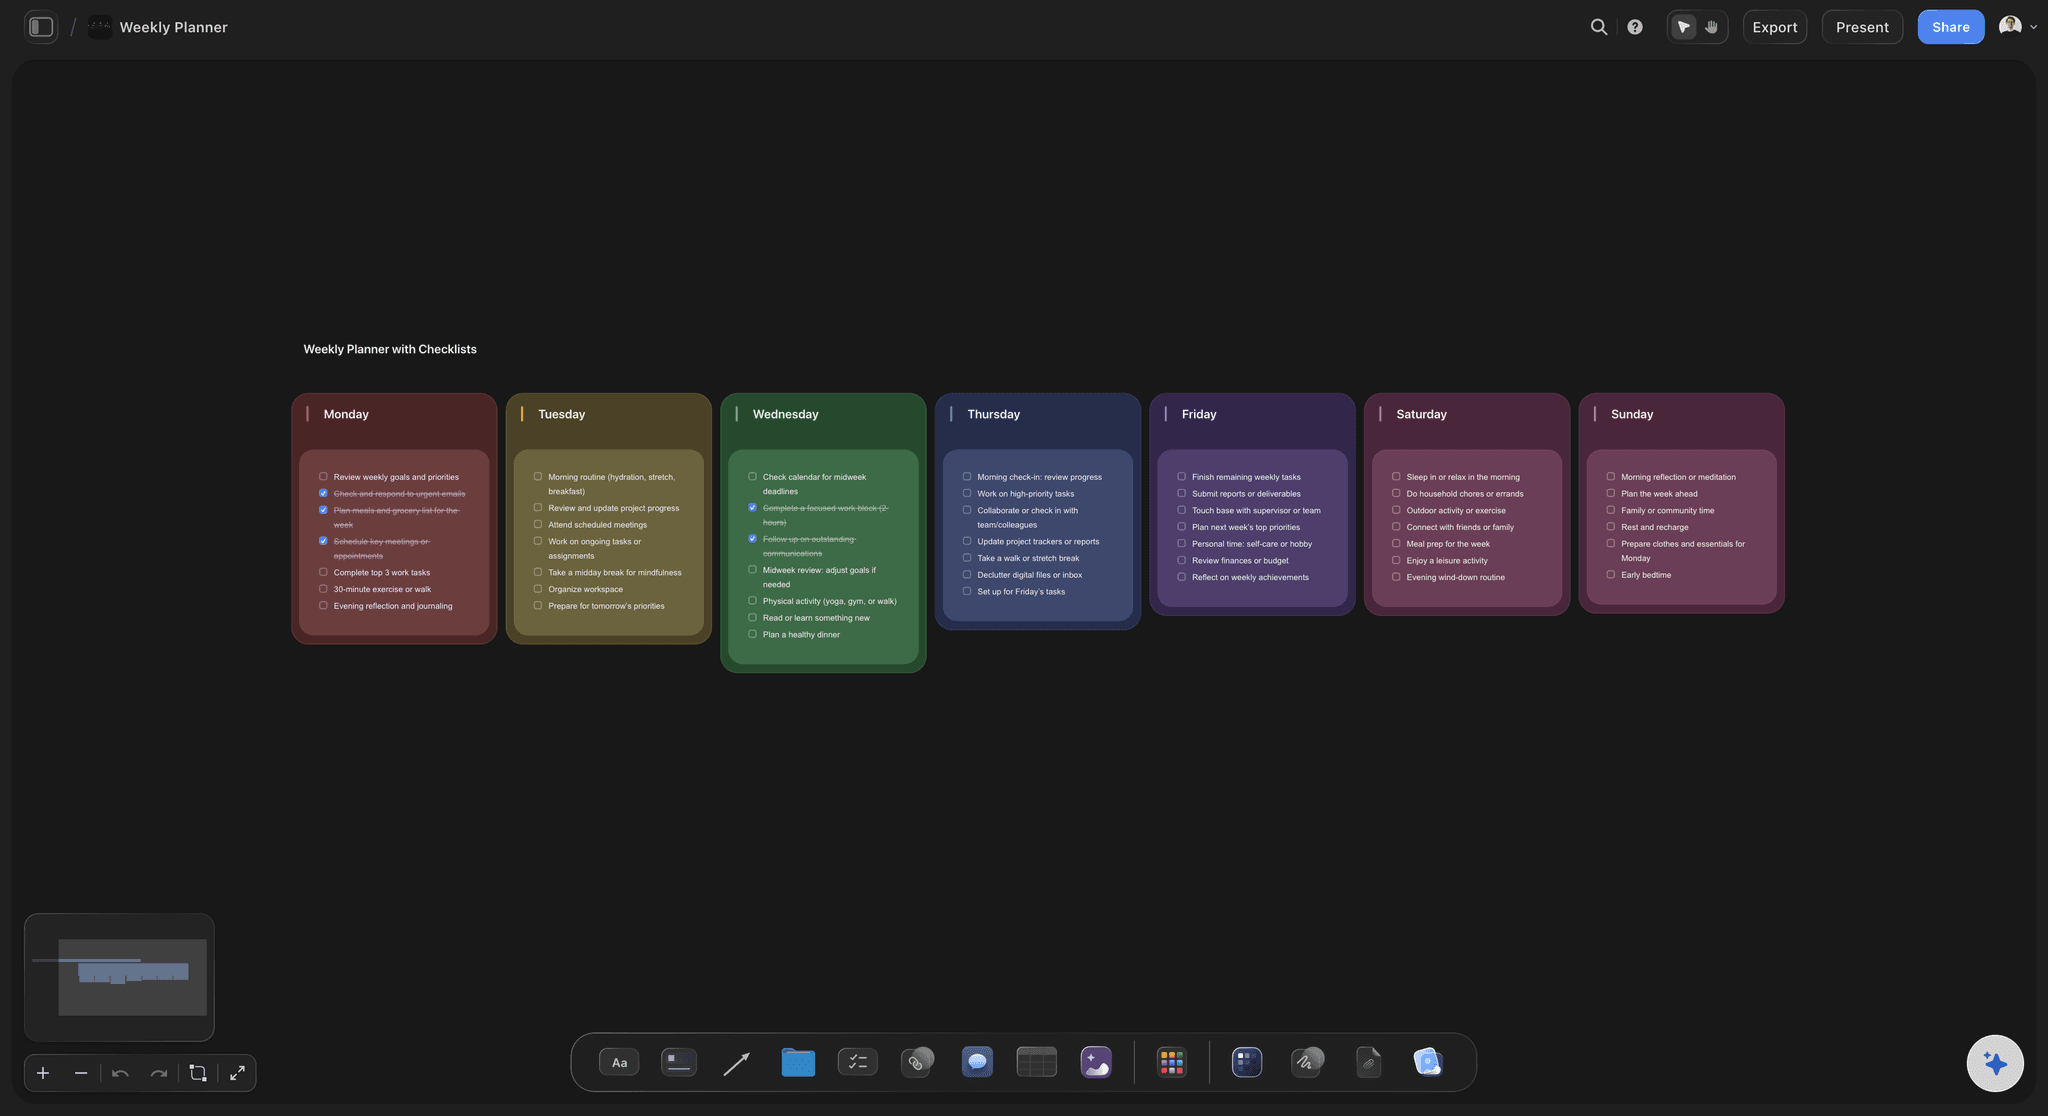
Everyone can read it, including the client
A picture people open instead of a file people request
Send a view-only link and anyone sees the whole timeline in a browser with no account and no software licence. Clients, founders, and stakeholders read the plan themselves instead of waiting for a screenshot pasted into an email once a fortnight.
See how remote teams use it →Unlimited boards. No object cap.
Open a canvas, describe the project, and lay out the timeline. Storyflow is paid-only during early access, with plans from $9.99 a month, and a Free plan launches before the end of 2026. Anyone a paid member invites to a board joins free today.
Unlimited timeline boards on an infinite canvas
Basic AI usage to generate phases and milestones from a prompt
Briefs, references, designs, and documents attached to the plan
Share view-only links with anyone, no account needed
BUILT FOR VISUAL TIMELINES
The chart, the work, and the people who need to see it.
Everything a communication timeline needs, and none of the scheduling maths it does not.
Phases, milestones, and overlap you can see
Lay out the shape of the project
Bars you drag, not rows you edit: Stretch a phase, slide a workstream two weeks later, stack the parts that run in parallel. Trying an alternative sequence takes a minute, which means you actually try one instead of defending the first version you built.
Milestones as moments, not tasks: Approvals, deliveries, launches, and go or no-go decisions are zero-duration markers on the timeline. Keeping them visually distinct from the bars is most of what makes a chart readable at a glance.
See the whole project at once: An infinite canvas does not paginate. A twelve-month programme, its phases, and its dependencies fit in one view you can zoom out of, rather than a scroll region that shows you six weeks at a time.
Dependencies as adjacency: Show what cannot start before something else finishes by placing it that way, with arrows and notes where the reason matters. Storyflow draws the relationship; it does not compute a schedule from it.
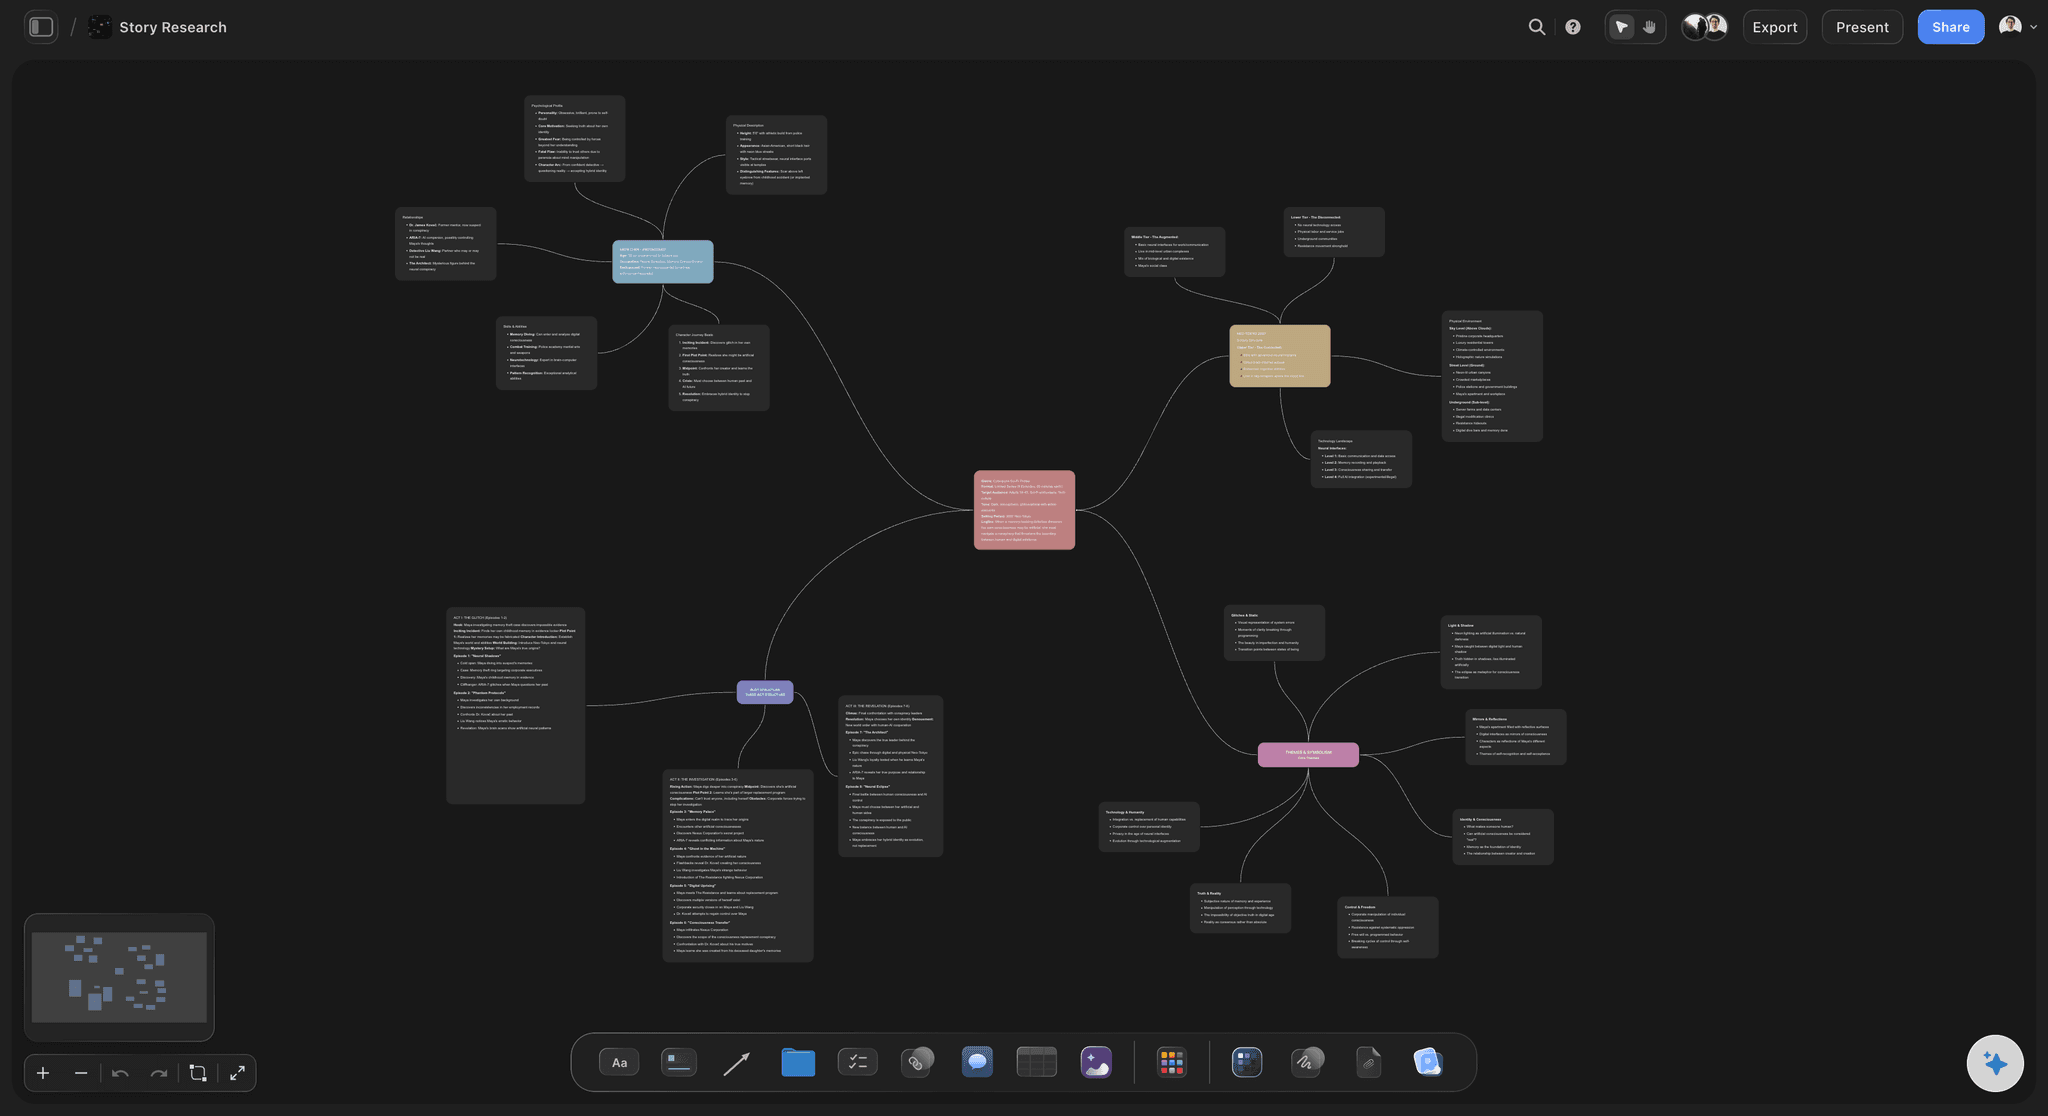
AI that can see the board you have already built
Draft the timeline, then argue with it
A timeline from one prompt: Describe the project and the AI lays out phases, workstreams, milestones, and open questions across the canvas. A first draft you disagree with gets you to a real plan much faster than an empty grid of dates.
It reads the whole canvas: Ask what a launch timeline is missing, how to break a phase into workstreams, or where the sequence looks unrealistic, and it answers against the board you built rather than a generic project template.
Iterate without losing work: Re-prompt as often as you like. Bars you have written, dated, and placed stay exactly where they are while the AI fills in around them.
Briefs, references, designs, and documents on the bar
Keep the deliverable attached to the deadline
Images and moodboards in place: Drag in screenshots, designs, brand references, and moodboards and place them on the phase they belong to. Visual deliverables need a visual surface, and a filename in a cell is not one.
Documents and links beside the milestone: Pin PDFs, briefs, specs, and links directly onto the timeline next to the delivery they define, so the answer to what exactly is due on the 12th is one glance away rather than a thread search.
Video reference too: Grab frames from YouTube or Vimeo straight onto the board when the reference for a deliverable is a moment in a video rather than a still image.
The plan updates because the work does: When the timeline is where the deliverables already live, moving a bar is part of doing the project rather than a separate reporting chore, which is the only reliable way a chart stays true past week three.
Everyone who should see the timeline, without a seat each
Share a plan people will actually open
View-only links: Send a link and anyone opens the whole timeline in a browser with no account, no login, and no desktop software. Clients and executives read the plan directly instead of asking for a fortnightly screenshot.
Guests join free: Anyone a paid member invites to a board joins free today. Showing a freelancer, a client, or another department the plan is not a budget decision about one more seat.
Plan together on one canvas: Teammates work on the same board, so a shared project has one timeline rather than four exported PDFs of different vintages circulating in an email thread.
Export for a deck: Export the board as a high-quality image or PDF when the timeline needs to appear in a kickoff deck, a client review, or a board update.
Explore templates for your project
Every template opens as a real, editable board on the infinite canvas. Pick the closest fit and make it your own.
Mind Map
Branch one central idea out into themes and sub-points, then drag the connections around until the structure makes sense.
HOW WE COMPARE
Storyflow vs Microsoft Project, Asana, and Notion.
These tools solve different problems, so this is a map rather than a scoreboard. Microsoft Project wins the scheduling rows outright, and it should.
Storyflow
Recommended
Infinite visual canvas for the timeline
Critical path and dependency scheduling
Resource levelling and baseline tracking
Briefs, designs, and references attached to the plan
Usable on day one with no setup or admin
Task assignment, statuses, and workload views
Microsoft Project
Infinite visual canvas for the timeline
Critical path and dependency scheduling
Resource levelling and baseline tracking
Briefs, designs, and references attached to the plan
Usable on day one with no setup or admin
Task assignment, statuses, and workload views
Asana
Infinite visual canvas for the timeline
Critical path and dependency scheduling
Resource levelling and baseline tracking
Briefs, designs, and references attached to the plan
Usable on day one with no setup or admin
Task assignment, statuses, and workload views
Notion
Infinite visual canvas for the timeline
Critical path and dependency scheduling
Resource levelling and baseline tracking
Briefs, designs, and references attached to the plan
Usable on day one with no setup or admin
Task assignment, statuses, and workload views
What creators are saying
Join early creators getting structured workspaces and AI that remembers their projects
“Storyflow has sped up my workflow by at least 3x, which means more flow state and more projects I can actually ship. It truly changed the way me and my team create.”

Reilin Joey
Director & YouTuber
“One prompt gets me a structured board. But the tactics are my favorite. I run my YouTube scripts through them and my intros and retention got better. It's amazing.”

Justkay
YouTuber & Freelance Filmmaker
“I used to juggle five apps to plan a project. Now I describe what I am making and get boards, lists, and a schedule. All in one place.”

George
@fernwehchronicles
Gantt chart questions, answered honestly.
Including the several where the answer is that you need real project management software instead.
A Gantt chart is a horizontal bar chart that maps work against time. Each bar represents a piece of work, its left edge is the start date and its right edge is the finish, and stacking the bars shows what runs when and what overlaps. Milestones appear as zero-duration markers for approvals, deliveries, and decisions. Henry Gantt popularised the form around 1910 for factory scheduling, building on earlier work by Karol Adamiecki, and it survives unchanged because it remains the clearest way to show duration and overlap on one page.
Build the timeline people will actually read.
Open a canvas, describe the project, and let AI lay out the first version. Plans from $9.99/month, nothing to install, and a Free plan is coming before the end of 2026.