
All Collections
AI Features
Changing a Chart the AI Made
Last updated: August 2026
A chart that is 90% right used to mean deleting it and asking again. Now it can be changed in place.
Asking for a change
Say what is wrong. The AI patches only that and keeps everything else — the chart's place on the board, its size, and the undo history that goes with it.
"Make it horizontal."
"Add October's number."
"Those should be percentages."
The change applies immediately and you can undo it like any other board edit.
One exception: a chart's type cannot be patched. A bar chart cannot become a line chart in place — that is a new chart and a deletion of the old one, and the AI will tell you so.
The chart's own menu
Every chart carries a "…" menu, always visible rather than hidden until hover, and it is the same menu the document header uses. From it you can:
- Switch style — the chart types that actually fit this data, plus the variants that matter for the type it is now: horizontal or vertical, stacked or not, values shown or hidden
- Save as image — a PNG at 2× resolution, taken from the chart as drawn
Charts in the reply
A chart drawn inside the AI's answer has the same menu, plus Add to board when you want to keep it. If you switch its type there, the choice is saved — reload the conversation and the chart is still drawn the way you left it. The AI's original answer is not rewritten; your choice rides alongside it.
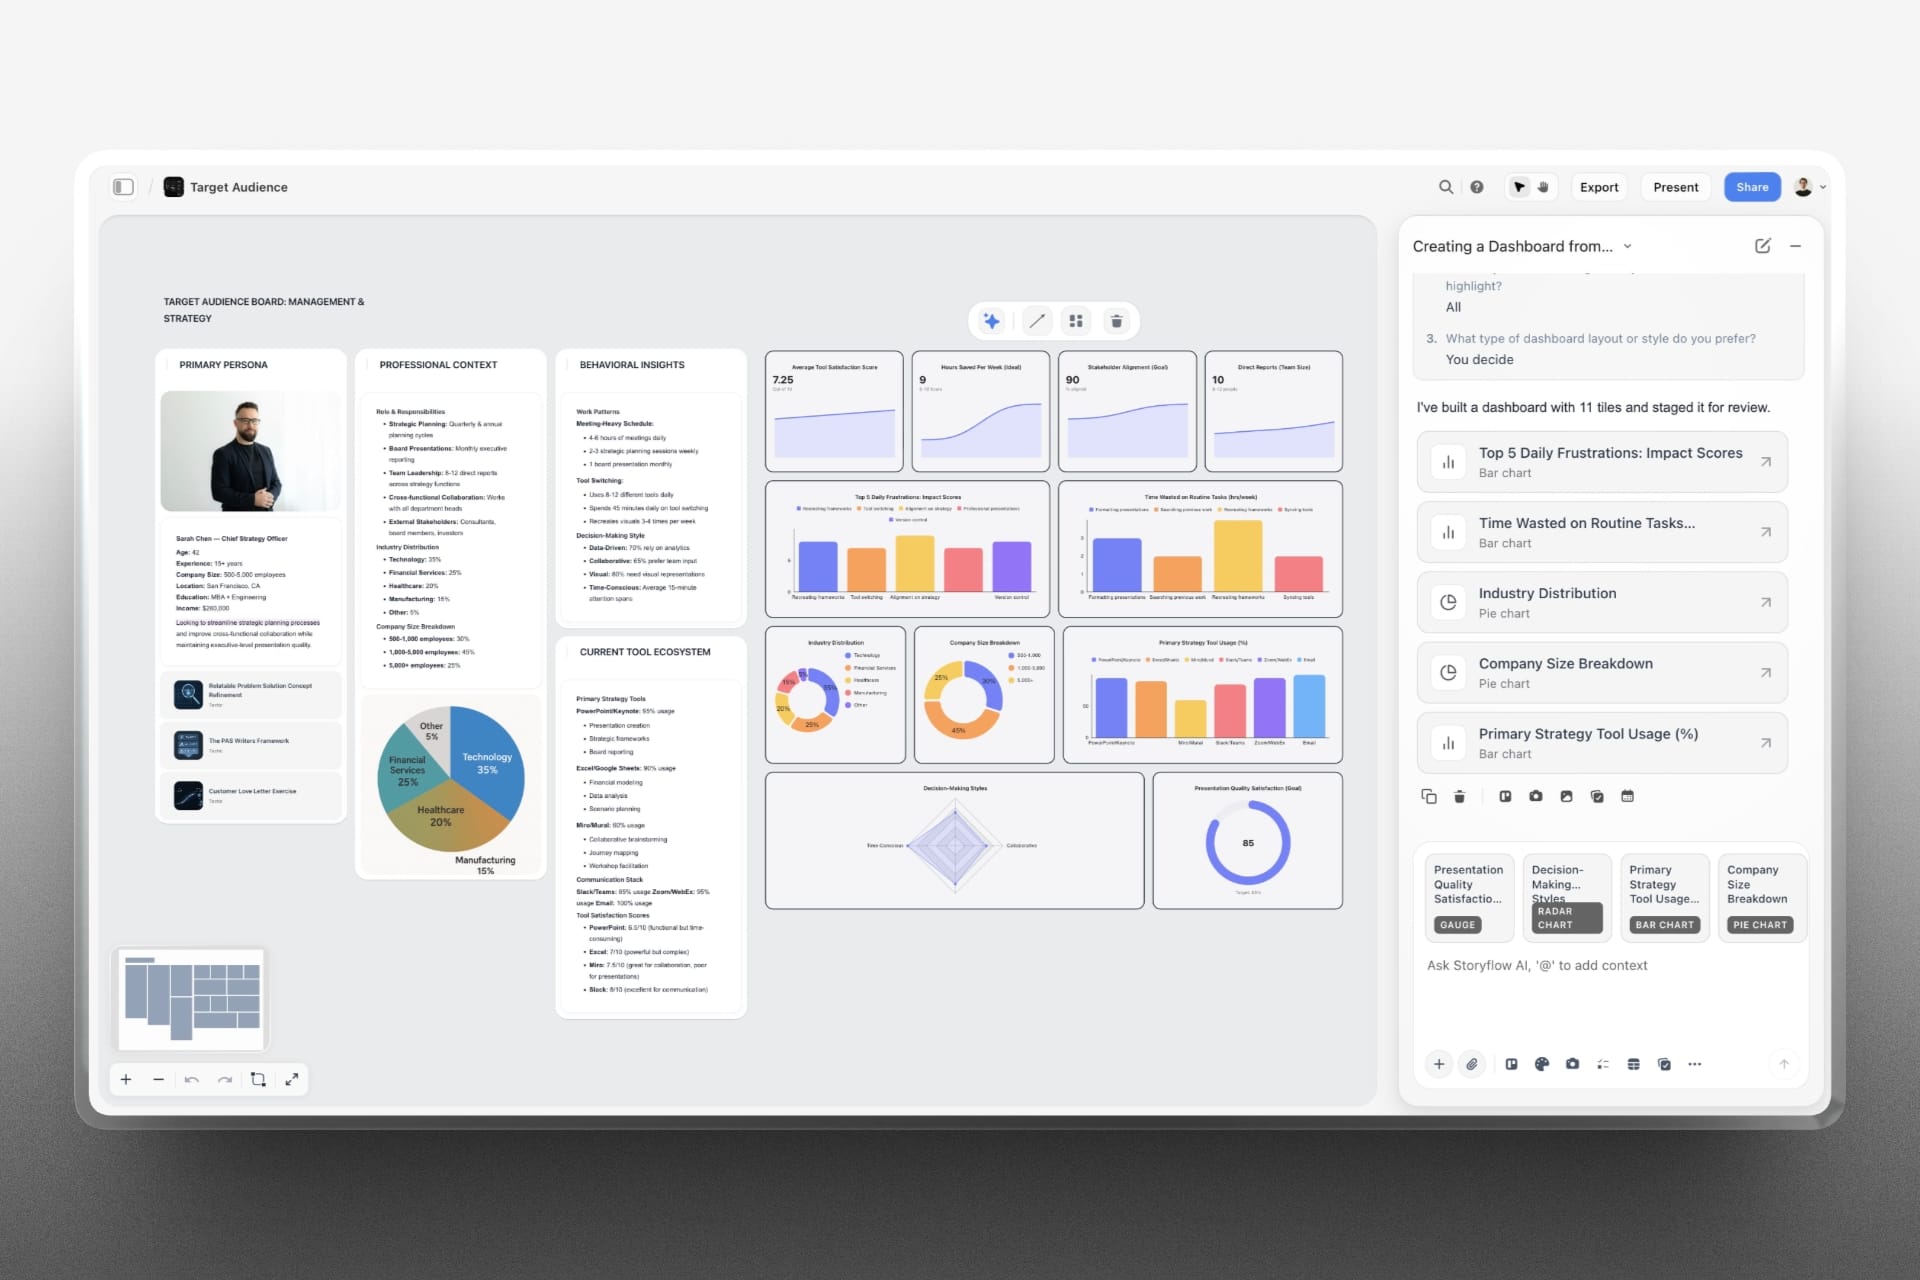
A dashboard's tiles preview in the reply too, but they are already on your board, so they offer Show on board rather than Add.
Use Cases
- Flip a cramped vertical bar chart to horizontal without rebuilding it
- Add the month that landed after the chart was made
- Take a PNG of a chart straight into a deck
- Try the same data as a line and keep the version you preferred
Was this article helpful?
Related Articles
Charts the AI Puts on Your Board
Charts Inside the Reply
Undoing What the AI Did
AI Dashboards