The 12 Best Lucidchart Alternatives in 2026 (Diagrams, Flowcharts, Whiteboards)
Lucidchart is good. It is also expensive, locked behind seats, and overkill for a lot of the work people use it for. We tested 12 alternatives across diagrams, flowcharts, and whiteboards: the right pick depends on whether your work is technical diagrams, workshops, lightweight flowcharts, or project-shaped canvases.

Category
Visual Thinking
Author

Justkay
Documentary Filmmaker & Founder at Storyflow
Topics
2026-05-09
•
16 min read
•
Visual ThinkingTable of Contents
- Quick Picks: Best Lucidchart Alternatives 2026 by Use Case
- Comparison Table: Best Lucidchart Alternatives 2026
- Why Teams Look for Lucidchart Alternatives in 2026
- How We Evaluated the Best Lucidchart Alternatives 2026
- Detailed Reviews: Best Lucidchart Alternatives 2026
- How to Choose the Right Lucidchart Alternative
- The Bottom Line
- Author
- 1. Storyflow
- 2. Miro
- 3. Whimsical
- 4. Diagrams.net (draw.io)
- 5. Creately
- 6. Visio
- 7. Figma + FigJam
- 8. Excalidraw
- 9. Mural
- 10. Cacoo
- 11. Gleek
- 12. SmartDraw
- FAQ: Best Lucidchart Alternatives 2026
- Related Reading
Templates to check out for this topic


What is the best Lucidchart alternative in 2026?
The best Lucidchart alternative depends on the actual job: Miro for enterprise teams that want diagrams plus workshops in one tool, Whimsical for fast clean flowcharts, Diagrams.net for free open-source technical diagrams, and Storyflow for project-shaped work where the AI reads the whole canvas before it answers. Storyflow is the strongest pick when your diagram is really a project (a campaign plan, product strategy, or creative brief), though it is not a technical-diagram tool and Lucidchart still wins on formal BPMN, UML, and network diagramming. We tested 12 alternatives across diagrams, flowcharts, and whiteboards. The right pick is not at the top of the list.
All 12 Lucidchart Alternatives, Ranked
- Miro: best for an enterprise whiteboard plus diagrams
- Storyflow: best for an AI-context project canvas, not technical diagrams
- Whimsical: best for lightweight diagrams plus mind maps
- Diagrams.net: best for free open-source diagrams
- Creately: best for affordable diagram-first work
- Visio: best for Microsoft 365 native diagrams
- Figma + FigJam: best for design teams doing diagrams
- Excalidraw: best for sketchy lightweight diagrams
- Mural: best for a workshop-first diagram surface
- Cacoo: best for realtime cloud diagrams
- SmartDraw: best for templated business diagrams
- Gleek: best for text-to-diagram generation
Full disclosure: Storyflow is our own product, and we deliberately do not rank it #1 here. For a general-purpose Lucidchart replacement Miro is the stronger pick, and for free open-source technical diagrams Diagrams.net is stronger. Storyflow is not a technical-diagram tool: no swimlane templates, no UML libraries, no engineering-grade ER-diagram fidelity, and Lucidchart still wins on formal BPMN and network maps. Storyflow only wins when your diagram is really a project and the AI reading the whole canvas is the unlock. We link to every tool so you can judge the fit.
Quick Comparison: Best Lucidchart Alternatives
These four cover the jobs people leave Lucidchart for: an enterprise whiteboard plus diagrams, a project canvas with AI context, fast clean flowcharts, and free open-source technical diagrams.
| Tool | Best For | AI Features | Price |
|---|---|---|---|
Miro | Enterprise whiteboard plus diagrams | Miro AI: diagram from text, summarize clusters | Free / $8 user/mo |
Storyflow | AI-context project canvas (not technical diagrams) | Reads full canvas + @-Tactics and Documents | Free / $9.99 mo |
Whimsical | Lightweight diagrams plus mind maps | AI diagram and doc generation | Free / $10 editor/mo |
Diagrams.net | Free open-source diagrams | No native AI; open-source engine | Free (open-source) |
Quick Picks: Best Lucidchart Alternatives 2026 by Use Case
Best for AI-Context Project Canvas: Storyflow Storyflow is not a Lucidchart replacement for technical diagrams. It is the right pick when your "diagram" is really a project: a brief, a strategy, a campaign plan, a creative concept that happens to need boxes and arrows. The AI reads the entire active canvas before it answers, plus any @-mentioned Tactics or Documents. Starts at $7.99/month billed annually (Plus tier). Limitation: no swimlane templates, no UML libraries, no engineering-grade ER-diagram fidelity. If your diagram needs formal notation, look further down this list.
Best Enterprise Lucidchart Alternative: Miro Miro covers diagrams plus the full whiteboard, workshop, and collaboration surface around them. Enterprises already paying for Lucidchart per seat often find Miro replaces three tools at once. Starts at $8/user/month annual. Limitation: diagrams are one of hundreds of Miro use cases. The dedicated diagram experience is less polished than Lucidchart or Whimsical for pure flowcharting.
Best Lightweight Diagrams + Whiteboard: Whimsical Whimsical is the cleanest, fastest tool for flowcharts, wireframes, and mind maps. Where Lucidchart feels heavy, Whimsical feels weightless. Starts at $10/editor/month. Limitation: not built for formal engineering diagrams or large enterprise libraries. The shape library is intentionally curated, not exhaustive.
Best Free Open-Source Lucidchart Alternative: Diagrams.net (draw.io) Free, forever. Self-host or run in the browser. The diagram engine is genuinely competitive with Lucidchart on flowcharts, network diagrams, ER diagrams, and UML. Limitation: the interface is utilitarian. No real-time multi-user collaboration in the way Lucidchart or Miro provide it out of the box.
Best Affordable Diagram-First Alternative: Creately Creately is the closest direct Lucidchart clone at a lower price point. Templates, shape libraries, and frameworks for engineering, business, and education are all there. Starts at around $5/user/month annual. Limitation: the interface feels a generation behind Lucidchart and Miro. Functional, not delightful.
Best Microsoft-Native Diagram Alternative: Visio If your organisation lives inside Microsoft 365, Visio is the path of least resistance. Tight integration with Teams, SharePoint, and Excel data sources. Starts at $5/user/month for Visio Plan 1. Limitation: real-time collaboration is improving but still trails Lucidchart and Miro. The UX is enterprise software, not consumer software.
Best Sketchy Lightweight Alternative: Excalidraw Excalidraw renders diagrams in a hand-drawn style that signals "this is a sketch, not a final spec". Free, open-source, and shockingly fast. The right tool when a perfect Lucidchart diagram would feel over-engineered. Limitation: not for production documentation. The sketchy aesthetic is the feature and the constraint.
Best for Design Teams Doing Diagrams: Figma + FigJam For design teams already paying for Figma, FigJam handles flowcharts and user-journey diagrams without buying a second tool. $3/collaborator seat per month annual. Limitation: not a serious technical-diagram tool. UML, ER diagrams, and network maps require manual setup that would take seconds in Lucidchart.
Storyflow's pitch is different from every tool above. It is not trying to be a better Lucidchart for technical diagrams. It is trying to be the project canvas where strategic, creative, and operational thinking lives, with AI that has read the whole board before it answers a single question. If your "diagram" is a project plan, a campaign strategy, or a creative brief that needs visual structure, take the next project you would have started in Lucidchart and build it on Storyflow's canvas instead. Ask the AI a question about the whole board and the difference is obvious in one session. For UML and engineering documentation, pick something further down this list.
Comparison Table: Best Lucidchart Alternatives 2026
| Tool | Best For | Starting Price | Free Plan | vs Lucidchart (★/5) | Rating (/10) |
|---|---|---|---|---|---|
Storyflow | AI-context project canvas | $7.99/month annual | Yes (unlimited shared boards, basic AI usage) | ★★★☆☆ | 9.0/10 |
Miro | Enterprise whiteboard plus diagrams | $8/user/month annual | Yes (3 boards) | ★★★★★ | 9.1/10 |
Whimsical | Lightweight diagrams plus mind maps | $10/editor/month | Yes (limited) | ★★★★☆ | 8.7/10 |
Diagrams.net | Free open-source diagrams | Free | Yes (fully free) | ★★★★☆ | 8.6/10 |
Creately | Affordable diagram-first | $5/user/month annual | Yes (limited) | ★★★★☆ | 8.2/10 |
Visio | Microsoft 365 native diagrams | $5/user/month | No (trial only) | ★★★★☆ | 8.0/10 |
Figma + FigJam | Design teams doing diagrams | $3/collab seat/month annual | Yes (Figma plan) | ★★★☆☆ | 7.8/10 |
Excalidraw | Sketchy lightweight diagrams | Free | Yes (fully free) | ★★★☆☆ | 7.7/10 |
Mural | Workshop-first diagram surface | $9.99/user/month annual | Yes (limited) | ★★★☆☆ | 7.5/10 |
Cacoo | Realtime cloud diagrams | $5/user/month annual | Yes (limited) | ★★★★☆ | 7.4/10 |
Gleek | Text-to-diagram generation | $5/user/month annual | Yes (limited) | ★★★☆☆ | 7.0/10 |
SmartDraw | Templated business diagrams | $9.95/user/month annual | No (trial only) | ★★★★☆ | 7.2/10 |
Rating criteria: Diagram depth was weighted most heavily (30%) because it is the actual category Lucidchart competes in. Collaboration (20%), ease of use (20%), AI and automation (15%), pricing (10%), integrations (5%).
A note on the Storyflow score. Storyflow rates 9.0/10 on the criteria above, but only ★★★ versus Lucidchart specifically. That is intentional. Storyflow is not the right tool when you need swimlane templates, UML libraries, or engineering-grade ER diagrams. It is the right tool when your work is project-shaped and AI canvas context is the unlock. The two scores measure different things. Read both.

Storyflow holds project structure, references, and Story blueprints on one connected canvas the AI can read in full
Why Teams Look for Lucidchart Alternatives in 2026
Lucidchart is not a bad product. It is a category-defining diagram tool with a polished UX, a deep shape library, and serious enterprise integrations. The reason "best Lucidchart alternatives" is one of the most-searched queries in this category is something else.
Reason one: per-seat pricing scales with the wrong thing. Lucidchart charges per editor. In a 50-person engineering org where 12 people draw diagrams and 38 people read them, the bill is for 50 seats anyway, because read-only access is a friction the org will not accept long-term. By year three, the bill is structural. Teams start asking whether a $4,000/year diagram tool is the best use of that budget.
Reason two: AI is now table stakes and Lucidchart's AI feels bolted on. In 2026, the question is no longer whether your diagram tool has AI. The question is whether the AI has any context beyond the shape you just selected. Lucidchart's AI generates diagrams from prompts, which is a useful party trick. It does not read the rest of your project. It is not X. It is Y: it is autocomplete, not a collaborator.
Reason three: most "diagrams" are actually projects. A meaningful percentage of Lucidchart usage is not technical diagrams at all. It is product roadmaps, marketing funnels, organisational charts, customer journey maps, and creative briefs that happen to need boxes and arrows. For that work, a tool optimised for UML and engineering documentation is overkill. Teams want a project canvas, not a diagram editor.
Reason four: enterprise lock-in. Lucidchart files do not export cleanly to other tools. Teams that adopted Lucidchart five years ago find migration is its own project. The alternatives that win are the ones that import Lucidchart files cleanly and let you keep the diagrams that already work.
The market is not abandoning Lucidchart. It is segmenting. Engineering and architecture teams are staying. Product, marketing, ops, and creative teams are leaving for tools that match their actual work.
How We Evaluated the Best Lucidchart Alternatives 2026
Five criteria determined every rating. Here is what each test specifically involved.
Diagram depth. I built the same three diagrams in every tool: a 30-node software architecture diagram, a six-swimlane process flow, and a customer journey map with 12 touchpoints. I measured how much manual setup each diagram required, how the shape libraries handled standard notation, and whether the resulting output looked like Lucidchart-quality work or felt like I was forcing the tool to behave.
Collaboration. I tested simultaneous editing with three users on the same diagram, comment threads, guest access without account requirements, and version history. The scenario was a typical product-engineering session: a PM, an engineer, and a designer working through a technical spec together.
Ease of use. I timed how long it took a new user to produce a complete flowchart from a blank canvas. Tools that required a tutorial scored lower than tools that worked from intuition. Toolbar friction, undo behaviour, and keyboard shortcut coverage all factored in.
AI and automation. I tested AI features on the same prompt: "generate a diagram showing the order fulfilment process for an ecommerce site". I scored on whether the AI produced a usable starting point, whether it had any context beyond the prompt itself, and whether the result was editable in a way that made the AI useful rather than gimmicky.
Pricing and integrations. I compared what a 10-person team pays annually across all tools, plus what each tool connects to. A diagram trapped inside one platform creates a handoff problem. A diagram that exports cleanly to Confluence, Notion, Slack, and engineering documentation is worth more.
Every tool on this list was tested with real project work, not feature checklists pulled from marketing pages.
Detailed Reviews: Best Lucidchart Alternatives 2026
1. Storyflow
Storyflow is a visual AI workspace built for creators, founders, and teams who think in projects rather than diagrams. It is not a 1:1 Lucidchart replacement. Saying that up front because the rest of this section is more useful when you know what Storyflow is and what it is not.
It is not a technical-diagram tool. There are no swimlane templates, no UML libraries, no engineering-grade ER-diagram shape sets. If your work is "draw the database schema for the new service" or "produce a formal BPMN diagram for compliance review", a dedicated tool like Lucidchart, Diagrams.net, or Visio will draw it faster, and Storyflow pairs cleanly alongside one. But most diagramming work is not really about the diagram.
It is a project-canvas-first tool with AI context. When your "diagram" is really a project (a campaign plan, a product strategy, a creative concept, a roadmap, a story arc), Storyflow's canvas is built to hold the whole thing in one place. The brief, the visual references, the structural framework, the to-do list, and yes, the boxes and arrows that connect them. The unlock is that the AI reads the entire active canvas before it responds. @-mention a Tactic and three Documents, and the AI has more context for your project than any other tool on this list provides for any kind of work.
Best for: Founders, marketers, creative leads, and project managers whose visual work is project-shaped, not formal-diagram-shaped, and who want AI that understands the whole board.
Key features:
Infinite canvas with project-aware AI. The whiteboard holds notes, images, frames, links, embedded documents, and connector arrows on an unlimited surface. AI chat reads everything currently on the canvas. Ask the AI a question about the strategy, the creative direction, or the next step, and it answers with full canvas context, not a single selected element.
200+ Story blueprints on Plus and up. Story blueprints are structured frameworks (Hero's Journey, AIDA, and 200+ others) that drop onto the canvas as guided card systems. Each card has AI assistance that understands the framework. For project work, this is closer to the actual unlock than another diagram template.
@-mention Tactics and Documents in AI chat. Inside any AI chat, @-mention one Tactic and up to three Documents to load specific structural and written context. The AI has the full active canvas plus the @-mentioned context simultaneously, which is the closest thing to a real collaborator any tool on this list offers.
Documents alongside the canvas. Write briefs, strategies, scripts, or notes as Documents inside the same project. They live next to the whiteboard, not in a separate app. This is what makes the @-mention pattern work: the context the AI needs is already in the project.
Real-time co-editing on the Max plan. The Max plan adds a team workspace with permissions and roles for multi-user work. Free already includes unlimited shared boards and unlimited collaboration. If you need the team workspace with roles, the Max plan starts at $39/month billed annually.
Pricing: Free (unlimited projects, basic AI usage, 20 file uploads). Plus: $7.99/month billed annually or $9.99/month billed monthly (full 200+ Story blueprints, unlimited file uploads). Pro: $14/month billed annually or $19/month billed monthly (adds AI image generation and 20× more AI than Plus). Max: $39/month billed annually with a team workspace, permissions, and roles.
Pros:
- AI canvas context is genuinely different from every Lucidchart-style tool. The AI has read the whole project, not the selected shape.
- 200+ Story blueprints (on Plus and up) replace the "blank canvas" problem that diagram tools have for non-technical work.
- Documents and whiteboard live in one project, removing the "where did the brief go" friction.
- Free plan is functional for solo project work: unlimited projects, basic AI usage, 20 file uploads, and unlimited shared boards.
- The Max plan's team workspace with roles supports the same multi-user workshops Lucidchart and Miro are used for.
Cons:
- Not a technical-diagram tool. No swimlane templates, no UML libraries, no engineering-grade ER-diagram fidelity. If you need formal diagram notation, this is the wrong pick.
- The team workspace with permissions and roles is a Max-plan feature. Lower tiers focus on solo project work.
- The AI workflow has a short learning curve. Teams expecting drag-shape-onto-canvas behaviour will need a few sessions to adjust to canvas-context AI as the primary interaction.
Verdict: Storyflow is the right pick when your work is project-shaped and the diagram is one part of a larger creative or strategic effort. It is the wrong pick when you need formal technical diagrams. Be honest about which job you have. If your "Lucidchart use" is mostly campaign plans, product strategies, and creative briefs, Storyflow is the upgrade. If your "Lucidchart use" is database schemas and BPMN diagrams, keep reading the list.
2. Miro
Miro is the tool most enterprises actually replace Lucidchart with when they decide one whiteboard tool can cover diagrams, workshops, retros, roadmaps, and design reviews. It is not the best pure diagram tool on this list. It is the best whiteboard tool that also does diagrams well enough to consolidate budgets.
The diagramming experience inside Miro has improved significantly. Smart shapes, auto-layout, swimlanes, BPMN templates, and a full shape library cover most of what Lucidchart offers for non-engineering work. The advantage is that the same canvas also handles sticky notes, voting, timers, and real-time facilitation features Lucidchart does not seriously compete on.
Best for: Enterprises and large teams that want one whiteboard tool to cover diagrams plus workshops, retros, roadmapping, and design reviews. The kind of team that is paying for three or four tools today and wants to consolidate.
Miro beats Lucidchart on collaboration, breadth, and template variety. The Miroverse community library is the largest collection of structured templates in this category. AI features have caught up with Lucidchart and in some cases overtaken them: Miro AI can now diagram from text prompts, summarise sticky note clusters, and generate next-step suggestions from board content.
Miro gives up some diagram polish versus Lucidchart. For pure flowcharting or formal UML, Lucidchart and Whimsical produce cleaner output with less manual cleanup. Miro's diagram tool is good. It is not best-in-class.
Pick Miro if your team's actual workload is broader than diagrams. If diagrams are 80% of the use case, Whimsical or Diagrams.net may serve better at lower cost. Miro is for teams whose diagrams sit alongside workshops, retros, journey maps, and roadmapping. Pricing starts at $8/user/month billed annually with a free plan that includes three editable boards.
3. Whimsical
Whimsical is the lightweight champion of this category. It loads fast, the UI is calm and uncluttered, and the diagrams it produces look polished by default. For flowcharts, wireframes, mind maps, and sticky-note style sequence diagrams, Whimsical is the tool I recommend most often when someone says "I just need to make a flowchart and I do not want to think about it".
The shape library is intentionally curated. You will not find every UML notation here. What you will find is the 80% set of shapes that 80% of diagrams actually use, presented in a way that makes producing a clean diagram in five minutes genuinely possible. Auto-layout, smart connectors, and keyboard shortcuts are all polished.
Best for: Product, design, and engineering teams who need quick flowcharts, mind maps, and wireframes without setting up a heavy enterprise tool.
Whimsical beats Lucidchart on speed and aesthetics. The output is cleaner with less effort. The pricing is more transparent. The free tier is generous enough for individual users.
Whimsical gives up diagram depth versus Lucidchart. There is no full UML library, no BPMN with formal notation, and no enterprise integration suite. For engineering documentation that needs to be technically precise, you will outgrow Whimsical.
Pick Whimsical if you want the tool that gets out of your way. Pricing starts at $10/editor/month with a free plan.
4. Diagrams.net (draw.io)
Diagrams.net is the answer to "I want Lucidchart but I do not want to pay for it". Free, open-source, and shockingly capable. The shape libraries cover flowcharts, network diagrams, AWS architecture, Azure architecture, GCP architecture, ER diagrams, UML, BPMN, and dozens of specialised notations. For pure diagram production, the engine is genuinely competitive with Lucidchart.
You can run Diagrams.net entirely in the browser, embed it in Confluence, Notion, or Jira, or self-host on your own infrastructure. The integration with Atlassian products is mature: many engineering teams use Diagrams.net inside Confluence and never visit a separate app.
Best for: Engineering teams, technical writers, and anyone who needs Lucidchart-quality diagrams without per-seat pricing.
Diagrams.net beats Lucidchart on price (free) and shape library breadth. For technical diagrams especially, the available notation sets are equal or larger than Lucidchart's.
Diagrams.net gives up real-time multi-user collaboration. There is no built-in equivalent to Lucidchart's simultaneous editing. The interface is utilitarian (it looks like 2014 software). The onboarding is non-existent: you open it and it expects you to know what you are doing.
Pick Diagrams.net if you are technically comfortable, you value functionality over polish, and you have an existing collaboration tool (Confluence, Notion, GitHub) where the diagrams will live. Free, forever.
5. Creately
Creately is the closest direct Lucidchart clone in this lineup, sold at a meaningfully lower price. The shape libraries, template variety, and overall feature set map almost feature-for-feature against Lucidchart. Where Lucidchart has UML, Creately has UML. Where Lucidchart has wireframes, Creately has wireframes. The interface is functional and familiar.
Creately's positioning is "everything Lucidchart does, cheaper". For organisations that have used Lucidchart and want to migrate without retraining the team, Creately is the smallest possible behavioural change.
Best for: Teams that want a direct Lucidchart replacement with a familiar workflow at a lower price point.
Creately beats Lucidchart on pricing. Starting at $5/user/month billed annually, the cost difference scales meaningfully across a 20-person team.
Creately gives up some interface polish. The UI feels a generation behind Lucidchart and Miro. It works. It is not delightful. AI features exist but feel less integrated than Lucidchart's.
Pick Creately if you want a Lucidchart-shaped tool at a Lucidchart-minus price and you do not mind the slightly older feel.
6. Visio
Visio is the tool you pick when your organisation is committed to Microsoft 365 and the path of least resistance matters more than choosing best-in-class for diagrams specifically. The integration with Teams, SharePoint, OneDrive, Excel data sources, and Power Automate is tight in a way no other tool on this list can match.
The diagram engine itself is strong. Visio's shape libraries for engineering, networking, floor plans, and business processes are deep. Visio Plan 1 runs in the browser; Plan 2 is the desktop app with the full feature set.
Best for: Microsoft 365 organisations where Teams, SharePoint, and Office integration are non-negotiable.
Visio beats Lucidchart on Microsoft integration and on the floor-plan and engineering shape libraries specifically. For data-driven diagrams that pull from Excel or Power BI, Visio is in a category of one.
Visio gives up real-time collaboration polish. Multi-user co-editing has improved but still trails Lucidchart and Miro. The UX is enterprise software, not consumer software. The mobile experience is limited.
Pick Visio if you live inside Microsoft 365 and tight integration is the priority. Pricing starts at $5/user/month for Visio Plan 1.
7. Figma + FigJam
Figma's diagram story sits across two products. FigJam handles whiteboard-style diagrams: flowcharts, user journeys, brainstorms, sticky-note clusters. Figma itself can hold structured diagrams as design files when you want pixel-perfect control over how they look. For design teams already paying for Figma, the math is obvious: the flowchart they would have made in Lucidchart now lives in FigJam at $3/collaborator seat per month annual.
FigJam in 2026 has matured significantly. Auto-flow connectors, sticky-note grouping, voting, and AI summarisation make it competitive with Miro for whiteboard-style work. The diagram experience is closer to Whimsical than Lucidchart: light, fast, and visually clean.
Best for: Design teams already on Figma who want their flowcharts and user-journey diagrams in the same ecosystem.
Figma + FigJam beats Lucidchart on aesthetics, on integration with design files, and on pricing for teams that already pay for Figma.
It gives up technical-diagram depth. FigJam is not built for UML, ER diagrams, or BPMN. The shape libraries are intentionally lifestyle, not technical. For engineering documentation, Lucidchart, Diagrams.net, or Visio remain better picks.
Pick FigJam if your team is design-led and your diagrams are user journeys, flowcharts, or product-strategy boards. Skip if you need formal technical notation.
8. Excalidraw
Excalidraw is the tool that signals "this is a sketch". The hand-drawn aesthetic is the entire point. When a polished Lucidchart diagram would feel over-engineered for a quick whiteboard session, Excalidraw is the right pick. It is free, open-source, runs in any browser, and has an AI feature that generates diagrams from text prompts.
The shape library is small and intentionally so. Rectangles, ellipses, arrows, text, images, and a few specialised shapes. That is the whole tool. The constraint is the feature.
Best for: Engineers, technical writers, and anyone who wants quick sketchy diagrams that communicate "draft" rather than "spec".
Excalidraw beats Lucidchart on speed, on price (free), and on signalling. A diagram in Excalidraw reads as exploratory in a way a Lucidchart diagram does not.
It gives up everything else. No formal notation, no enterprise integrations, no production-grade output. Excalidraw is a sketch tool, not a documentation tool.
Pick Excalidraw for early-stage architecture conversations, for quick whiteboard sessions in a remote meeting, and for any diagram where polish would be a liability. Free, forever.
9. Mural
Mural is Miro's closest peer. Both are whiteboard-first tools that handle diagrams well enough to replace Lucidchart for many teams. Mural's positioning is workshop-first: facilitation features, structured templates for design thinking, agile retros, and innovation methods are deeper out of the box than Miro's.
The diagram experience inside Mural is competent. Smart shapes, connectors, and an expanding template library cover most non-engineering use cases.
Best for: Workshop facilitators, innovation teams, and consulting groups who run a lot of structured collaborative sessions.
Mural beats Lucidchart on facilitation depth and on the structured template library for design thinking and innovation work specifically.
Mural gives up some diagram polish versus Whimsical and Lucidchart. The flowcharts it produces are functional, not best-in-class. Pricing is higher than several alternatives on this list.
Pick Mural if facilitated workshops are central to how your team operates and the diagram is a side benefit. Starts at $9.99/user/month billed annually.
10. Cacoo
Cacoo is a cloud-based diagram tool from Nulab that competes directly with Lucidchart on real-time collaboration and templates. The shape libraries are solid: flowcharts, network diagrams, mind maps, wireframes, and ER diagrams. The interface is clean, the pricing is reasonable, and the integrations with Confluence, Slack, and Google Drive are mature.
Cacoo's distinguishing feature is the speed of collaborative editing. Multiple users on the same diagram simultaneously feels smoother than Lucidchart in informal testing. For teams that diagram together rather than alone, that latency difference matters.
Best for: Distributed teams that need real-time multi-user diagram editing with a familiar feature set at a moderate price.
Cacoo beats Lucidchart on collaborative-editing smoothness and on price. Starting at $5/user/month billed annually, the cost-per-seat is meaningfully lower.
Cacoo gives up some shape-library depth and template variety versus Lucidchart. The community of templates and shared resources is smaller. AI features are less developed.
Pick Cacoo if real-time collaborative diagramming is the primary workflow and you want a familiar Lucidchart-style tool without the price.
11. Gleek
Gleek is the outlier on this list. It is not a visual diagram editor in the traditional sense. You write text in a structured syntax and Gleek renders the diagram for you. Sequence diagrams, flowcharts, ER diagrams, and class diagrams all work this way.
For developers who already think in code, this is a natural fit. The text source is version-controllable, diff-able in pull requests, and updates the diagram automatically. You do not drag shapes. You type the diagram description.
Best for: Developers and technical writers who want diagrams as code, with text-first authoring and automatic rendering.
Gleek beats Lucidchart on speed for the specific case where the diagrammer is comfortable with text syntax. For Mermaid-style workflows and for teams that store diagrams in Git alongside source code, Gleek is faster than any drag-and-drop tool.
Gleek gives up the visual-editor experience entirely. For non-technical teammates, the text-first approach is a non-starter. The diagram aesthetic is intentionally simple.
Pick Gleek if your team writes diagrams more than draws them. Starts at $5/user/month billed annually.
12. SmartDraw
SmartDraw is the tool optimised for templated business diagrams. Org charts, floor plans, decision trees, and engineering schematics are produced via large template libraries with auto-layout that handles much of the manual work for you.
The shape libraries are deep, especially for business-document use cases. The Visio file compatibility is strong, which makes SmartDraw a common migration target for organisations leaving Visio without committing to Microsoft 365.
Best for: Business teams that produce a high volume of standard diagrams (org charts, floor plans, process documents) and value template-driven speed.
SmartDraw beats Lucidchart on template variety for business diagrams specifically. The auto-layout algorithms produce cleaner output for org charts than most alternatives.
SmartDraw gives up modern collaboration polish. Real-time multi-user editing exists but trails Lucidchart and Miro. The interface is dated. There is no permanent free plan.
Pick SmartDraw if you produce a high volume of templated business diagrams and the auto-layout speed advantage outweighs interface modernity. Starts at $9.95/user/month billed annually.
AI Planner turns project context on the canvas into a structured sequence of next steps
Kanban view tracks tasks through stages while staying connected to the source project canvas
How to Choose the Right Lucidchart Alternative
Start with the actual job, not the category. "Lucidchart alternative" is a search term. It is not a coherent product category. The right pick depends on what your "Lucidchart use" actually is.
If your work is technical diagrams (UML, ER, BPMN, network maps, architecture): Diagrams.net (free), Visio (Microsoft-native), or Creately (Lucidchart-shape with cheaper pricing) are the strongest replacements for the drawing itself. Storyflow pairs well alongside them for the project the diagram belongs to: the brief, the plan, and the strategy around it.
If your work is workshops, retros, and collaborative diagram sessions: Miro or Mural are the right scale. Lucidchart's collaboration is good. Miro's collaboration is the category-defining experience.
If your work is flowcharts, mind maps, or wireframes that need to look clean fast: Whimsical. It is the tool I recommend most often for the "I just need to draw a quick flowchart" case.
If your work is sketchy whiteboard sessions where polish would be a liability: Excalidraw. Free. Fast. Communicates "draft".
If your work is project planning, strategy, creative briefs, or campaign concepts that happen to need visual structure: Storyflow. The AI canvas context changes the work. Not for technical diagrams.
If your work lives inside Microsoft 365: Visio. The integration math is unbeatable.
If your work is design-led and you already pay for Figma: FigJam. No reason to add a separate tool.
If your priority is maximum savings: Diagrams.net (free) or Creately ($5/user/month annual).
The mistake to avoid is picking the tool with the longest feature list. The tool with the longest feature list is usually Lucidchart, which is what you are trying to leave. Pick the tool that is shaped like your work.

Storyflow's paid tiers unlock 200+ Story blueprints for project-shaped work where AI canvas context is the unlock
The Bottom Line
The right Lucidchart alternative depends on which job you are actually doing. There is no single answer, which is exactly why "best Lucidchart alternative" gets searched so often: most people typing the query are looking for a tool that fits their specific work better than the general-purpose diagram editor they currently pay for.
For engineering teams that need formal technical diagrams: Diagrams.net (free) or Visio (Microsoft-native) are the strongest replacements. Both produce Lucidchart-quality output and both have mature ecosystems.
For enterprises that want one tool to cover diagrams plus workshops plus collaboration: Miro is the consolidation play. The cost looks higher per seat but lower across the three or four tools it replaces.
For teams that need clean flowcharts and mind maps fast: Whimsical. It gets out of the way.
For project-shaped work where AI canvas context matters: Storyflow. It is not a Lucidchart replacement for technical diagrams. It is the upgrade for project planning, strategy, creative work, and the kind of "diagram" that is actually a project. Take your most active project, rebuild it on Storyflow's canvas for one week, and let the AI read the whole board. By the end the decision makes itself.
The mistake to avoid is treating "Lucidchart alternative" as a single category. It is not X. It is Y: it is at least four different categories of work that all happen to use boxes and arrows. Pick the tool shaped like your work, not the tool with the longest feature list.
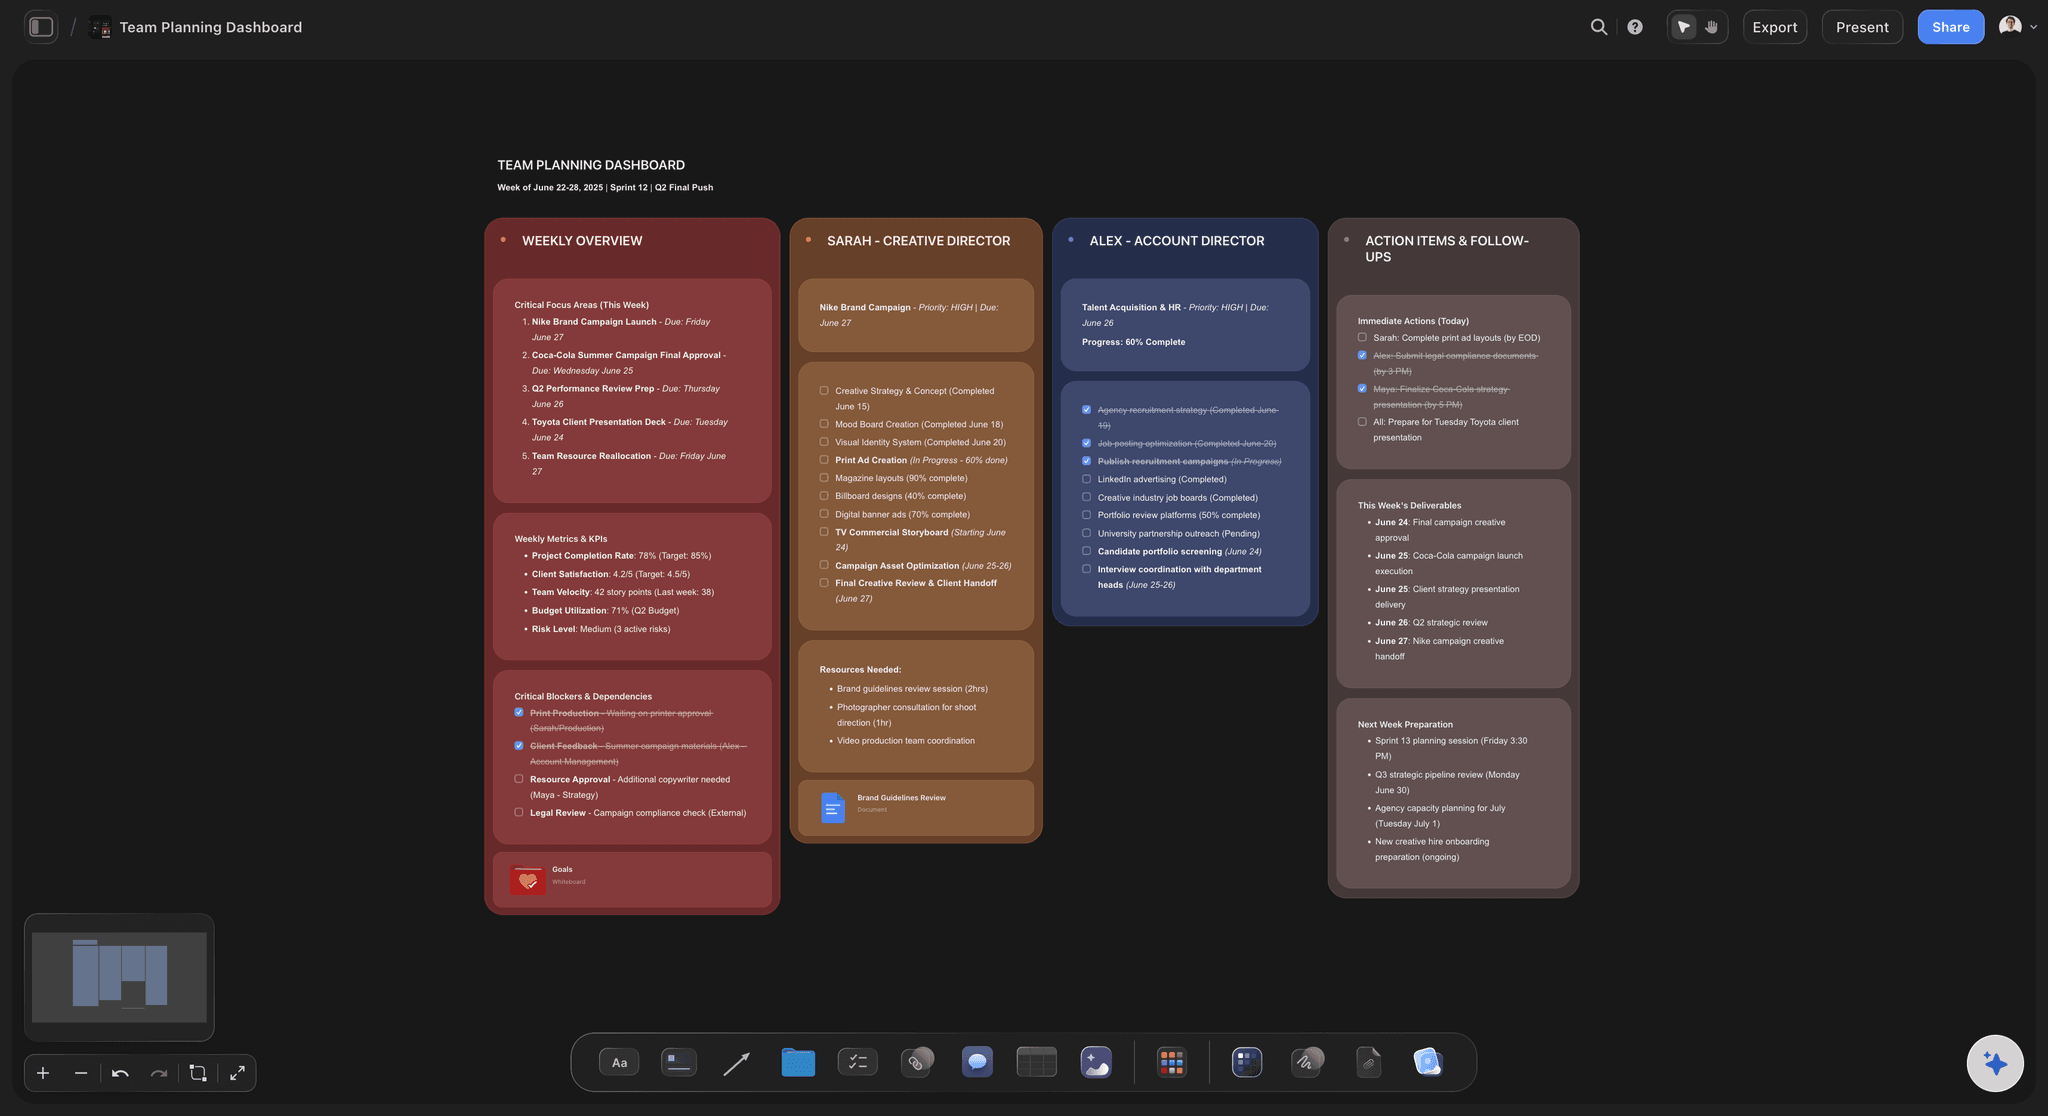
A project-shaped board in Storyflow: tasks, owners, and stages on one canvas the AI reads in full, the work Lucidchart was never built to hold
FAQ: Best Lucidchart Alternatives 2026
What is the best Lucidchart alternative in 2026?
Miro is the best general-purpose Lucidchart alternative for most enterprise teams in 2026, because it covers diagrams plus the full whiteboard and workshop surface in one tool. For pure flowcharts and mind maps, Whimsical is faster and cleaner. For free open-source diagrams, Diagrams.net is competitive with Lucidchart on engine quality. For project-shaped work where AI canvas context is the unlock, Storyflow is the right answer, with the caveat that it is not a technical-diagram tool.
Is there a free Lucidchart alternative that actually works?
Yes. Diagrams.net (also known as draw.io) is free, open-source, and competitive with Lucidchart on flowcharts, network diagrams, ER diagrams, and UML. Excalidraw is free for sketchy whiteboard-style diagrams. Storyflow's free plan includes unlimited projects, basic AI usage, 20 file uploads, which covers solo project work without paying for anything. None of the free tiers match Lucidchart on real-time collaboration depth, but for individual use, the free options are strong.
What is the cheapest Lucidchart alternative?
Diagrams.net is the cheapest option because it is free forever. For paid alternatives with real-time collaboration, Creately and Cacoo both start at $5/user/month billed annually, which is meaningfully cheaper than Lucidchart's per-seat pricing. Visio Plan 1 also starts at $5/user/month if you are inside Microsoft 365.
Can Storyflow replace Lucidchart?
For technical diagrams: no. Storyflow does not have swimlane templates, UML libraries, or engineering-grade ER-diagram fidelity. For project work that happens to need boxes and arrows (campaign plans, product strategies, creative briefs, roadmaps): yes. Storyflow's AI reads the entire active canvas and supports @-mentioning Tactics and Documents, which is closer to a real collaborator than any Lucidchart-style tool offers. Be honest about which kind of work you have before switching.
Which Lucidchart alternative is best for software architecture diagrams?
Diagrams.net is the strongest free option for software architecture diagrams. The AWS, Azure, and GCP shape libraries are mature. For paid options with collaborative editing, Lucidchart itself remains best-in-class for this specific use case, which is why it is hard to replace for engineering teams. Visio Plan 2 with the desktop app is the closest paid alternative for technical depth.
Is Miro better than Lucidchart for diagrams?
For diagrams alone, Lucidchart is more polished. For diagrams plus workshops, retros, journey maps, and roadmapping in one tool, Miro is better. The decision hinges on whether your team needs a diagram tool or a whiteboard tool that does diagrams. Most enterprises that switch from Lucidchart to Miro do so because Miro consolidates three tools into one.
Can I import Lucidchart files into another tool?
Diagrams.net and Visio both import Lucidchart files reasonably well. Creately and Cacoo also support Lucidchart import. Miro supports Lucidchart import for many but not all diagram types. Whimsical and Storyflow do not support direct Lucidchart import. Before migrating, export a representative diagram from Lucidchart and test the import in your candidate tool. The fidelity varies more than vendor marketing pages suggest.
What is the best Lucidchart alternative for non-technical teams?
For marketing, product, and creative teams, Whimsical or Storyflow are stronger picks than Lucidchart. Whimsical's clean, fast diagram experience suits non-technical workflows. Storyflow's project-canvas-with-AI fits teams whose "diagrams" are really campaign plans, product strategies, or creative briefs. Lucidchart was built for engineering documentation. For non-technical work, it is overkill.
Does Lucidchart have a real AI feature in 2026?
Lucidchart has AI generation that creates diagrams from text prompts, plus a Smart Shapes feature that suggests shape improvements. The AI works on the selected element, not the full project. For deeper canvas-aware AI, Storyflow's approach (AI reads the entire active canvas plus @-mentioned Tactics and Documents) is the most differentiated in this lineup. Miro and Whimsical have AI features that are competitive with Lucidchart's.
How do I choose between Storyflow and a traditional diagram tool?
Ask what your "diagram" actually is. If it is a database schema, a UML class diagram, a network architecture map, or any formal technical notation, pick a traditional tool: Lucidchart, Diagrams.net, Visio, or Creately. If it is a project (a campaign plan, a product strategy, a creative brief, a roadmap, a story arc) that needs visual structure, Storyflow is the right shape. The AI canvas context is the unlock for project-shaped work and irrelevant for formal technical diagramming.
Planning and project templates you can use in Storyflow
Plan a launch, a sprint, or a whole project on a visual board the team can see at once. Open one of these templates and start from real structure.


See Storyflow in Action
A visual AI workspace where every feature lives inside one canvas. No tab-switching, no context lost.
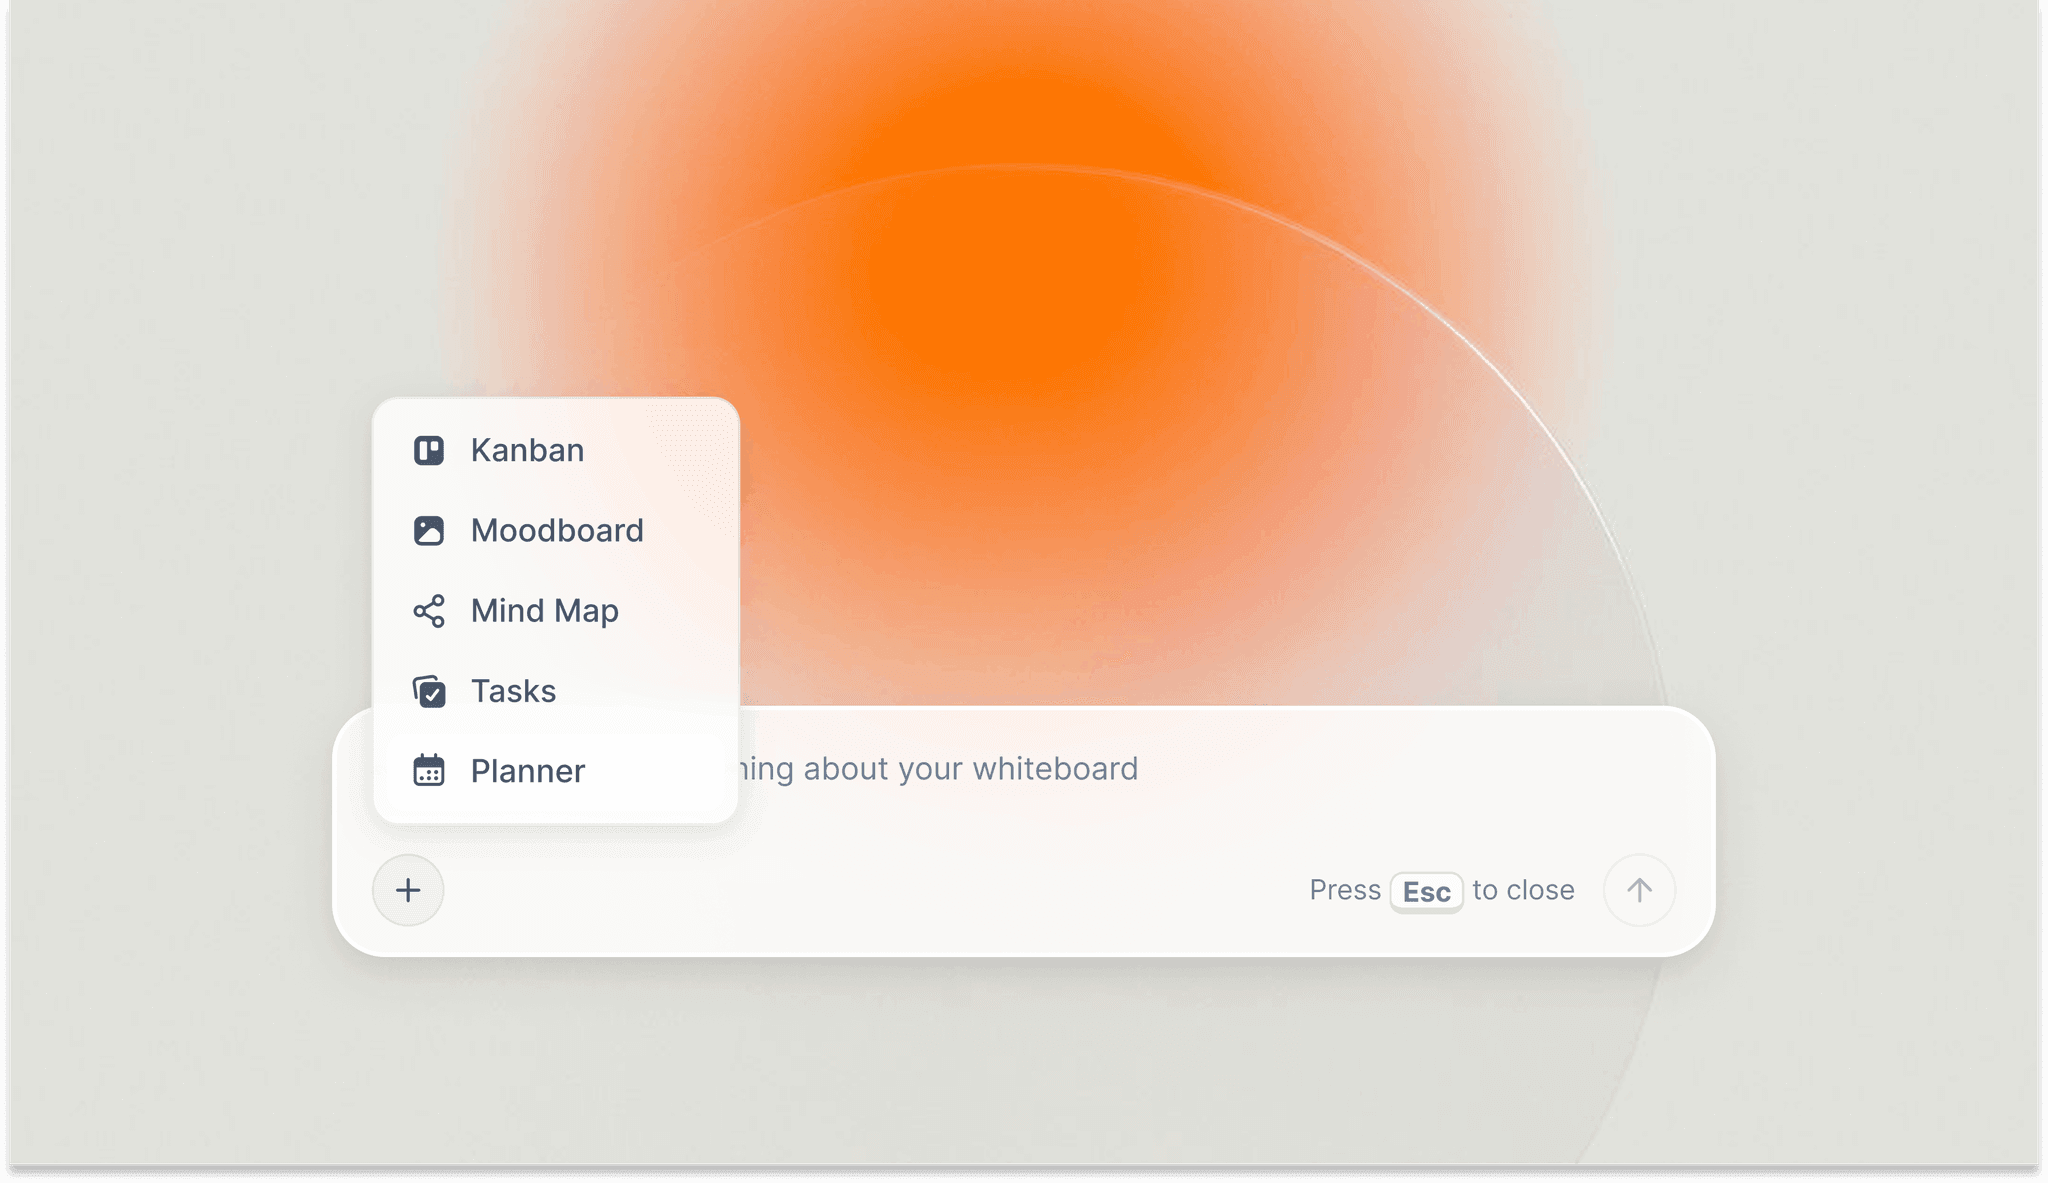
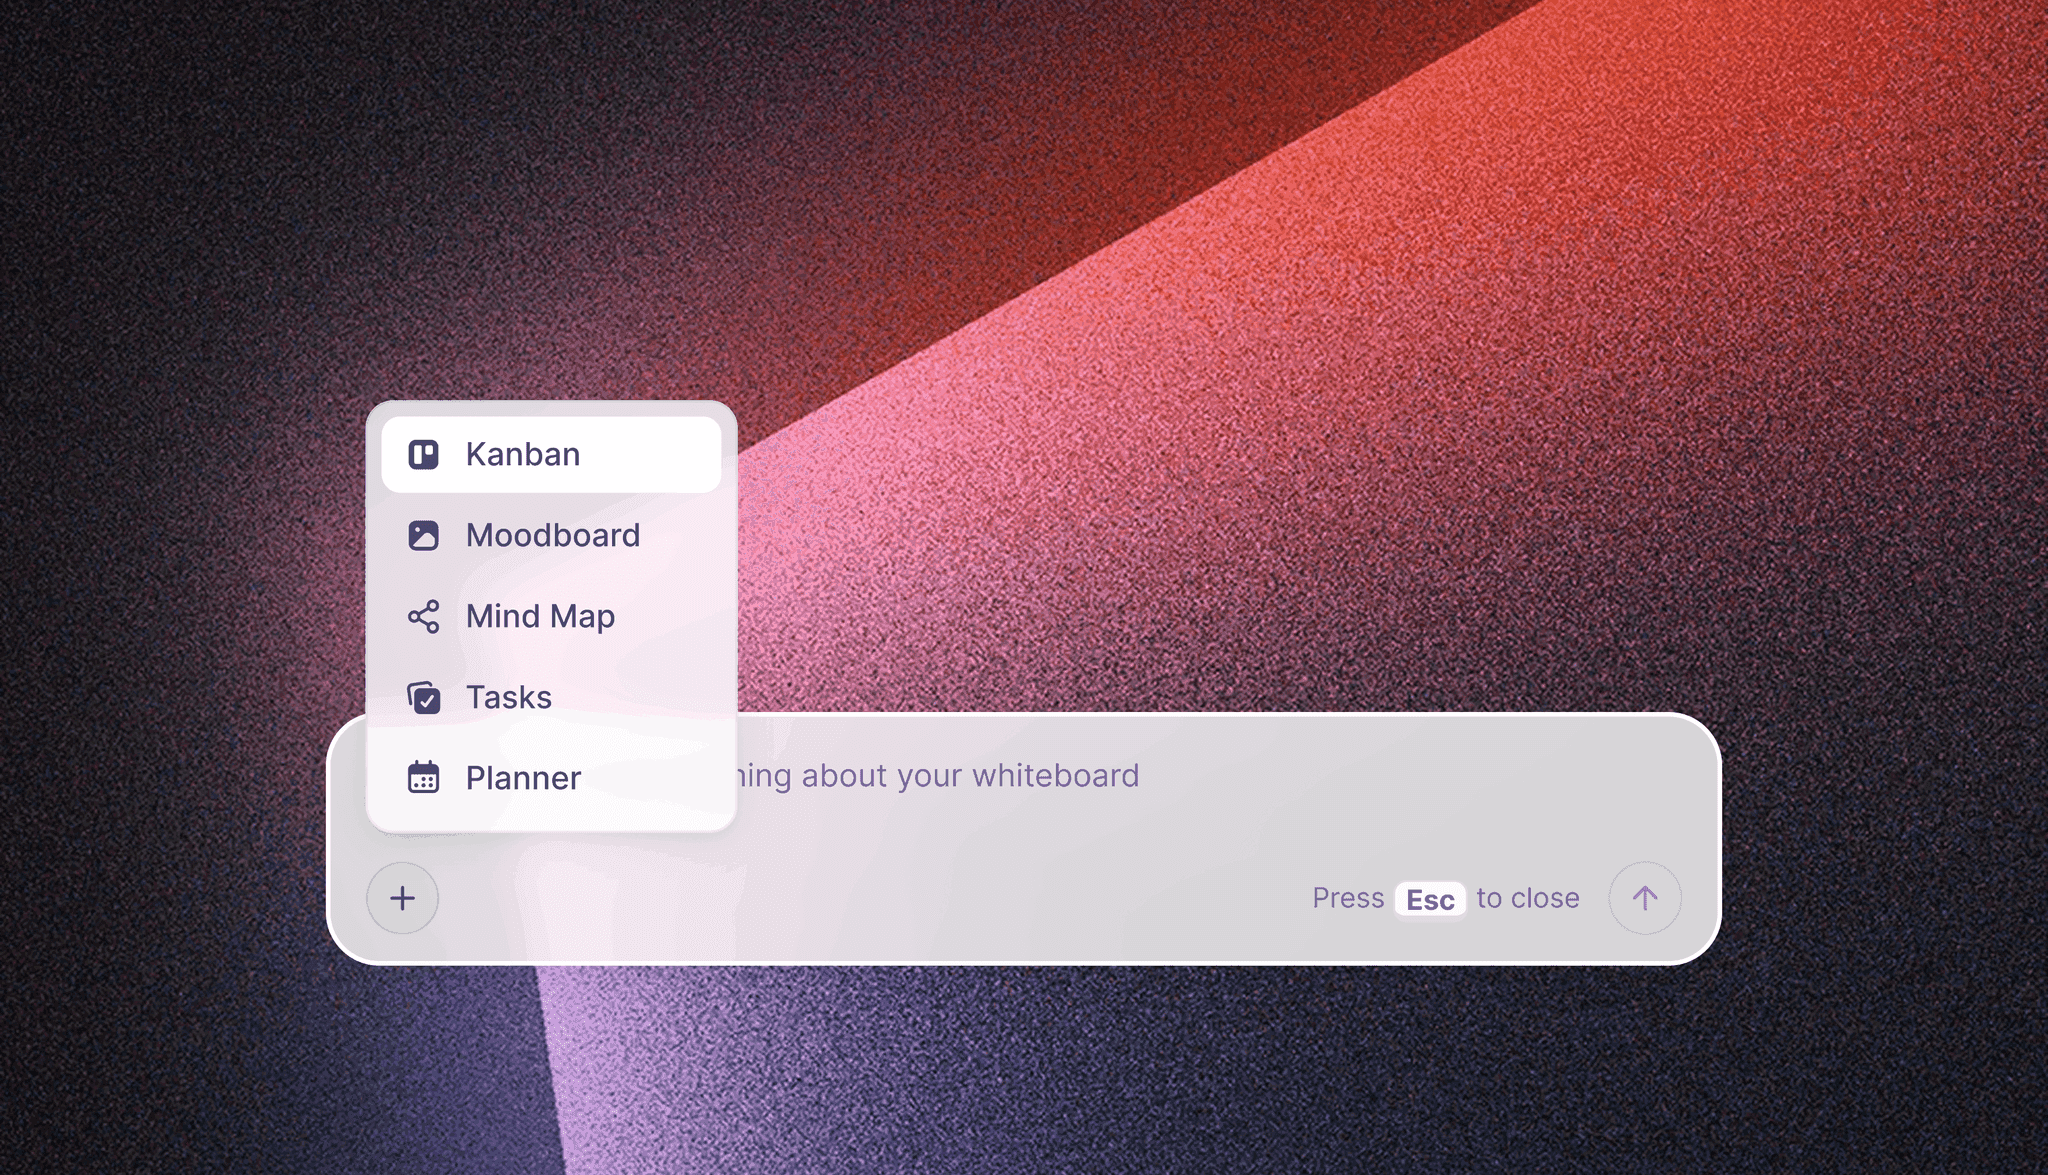
Build your entire board from a single message
Type what you need in the AI chat at the bottom of your canvas. The AI adds cards, headings, and structure directly onto your board.
Use expert frameworks as AI context
Type @ in the AI chat and choose any Tactic. The AI tailors every response to that framework instead of giving generic advice.
Turn your board into a mind map in seconds
Ask the AI to restructure your canvas as a mindmap. It connects your ideas into a visual hierarchy so you can see how everything relates.
Why Storyflow Exists
Storyflow actually began as a personal tool while working on creative and research projects.
We kept running into the same problem: ideas were scattered everywhere: notes, documents, and whiteboards.
Nothing helped us see how everything connected.
So we started building a workspace designed around how ideas actually grow.
→ Read how Storyflow was createdJustkay
Documentary Filmmaker & Founder at Storyflow
Published: 2026-05-09
Start creating with AI and become more productive
Transform your creative workflow with AI-powered tools. Generate ideas, create content, and boost your productivity in minutes instead of hours.
Ask Storyflow to