What is Visual Thinking? The Complete Guide (2026)
Visual thinking is the cognitive practice of using images, diagrams, and spatial relationships, rather than linear text, to organize, generate, and communicate ideas. Here's the definition, the science behind why it works, seven core techniques, and exactly how to start.

Category
Creativity
Author

Sara de Klein
Head of Product at Storyflow
Topics
February 27, 2026
•
20 min read
•
CreativityTable of Contents
Templates to check out for this topic


What is visual thinking?
Visual thinking is a cognitive approach that uses images, diagrams, and spatial relationships, rather than linear text, to organize, generate, and communicate ideas. Unlike note-taking or written analysis, visual thinking externalizes the structure of thought itself, making abstract concepts tangible. The human brain processes visual information 60,000 times faster than text, which means representing ideas spatially dramatically reduces cognitive load and makes connections, gaps, and contradictions visible that are impossible to see in linear writing.
Most people who struggle with complex ideas are not struggling because the ideas are too hard. They are struggling because they are trying to think in a format that does not match the shape of the problem. A film narrative, a marketing strategy, a product architecture, these are webs of relationships, not chains of steps. When you try to hold a web in your head sequentially, it collapses. Visual thinking gives you a way to work with ideas in the shape they actually take.
This guide covers the definition, the cognitive science behind why it works, the seven core techniques, the tools that support it, and exactly how to start, whether you have never drawn a diagram in your professional life or you use visual tools daily but want to use them more deliberately.
What is Visual Thinking? The Definition
Visual thinking definition:
"Visual thinking is a cognitive approach that uses images, diagrams, and spatial relationships, rather than linear text, to organize, generate, and communicate ideas. Unlike note-taking or written analysis, visual thinking externalizes the structure of thought itself, making abstract concepts tangible. It is the foundation of how designers, filmmakers, strategists, and scientists do their best work."
Visual thinking is not a personality trait or a talent you either have or don't. It is a learnable practice, a deliberate shift from processing information sequentially (one idea after another) to processing it spatially (all ideas at once, with their relationships visible).
The distinction matters because most ideas are not linear. When you sketch a rough diagram of a concept before writing about it, when you map out how scenes connect before scripting them, or when you draw the relationship between two competing options, that is visual thinking at work.
Visual thinking is distinguished from list-making by its emphasis on relationships. The connections between ideas are often more important than the ideas themselves, and drawing connections forces you to be explicit about why two things are related, not just that they are.
Why Visual Thinking Matters
The human brain processes visual information 60,000 times faster than text, according to research from 3M Corporation. This is not a minor efficiency gain, it reflects a fundamental asymmetry in how the brain is built. Roughly 30% of the cortex is dedicated to visual processing, compared to 8% for touch and 3% for hearing.
What this means practically: when you represent an idea visually, you dramatically reduce the cognitive load required to hold it in working memory. You can see contradictions, gaps, and connections that are invisible in linear text. The diagram does the memory work, freeing your mind to do the thinking.
323% faster comprehension
A 2019 Nielsen Norman Group study found users comprehend well-structured visual information 323% faster than text for complex, multi-part concepts.
40% faster disagreement resolution
Teams with shared visual representations resolved disagreements 40% faster than teams working from written briefs alone, per MIT Media Lab research.
4-chunk working memory limit
The human brain can hold approximately 4 "chunks" of information at once (Cowan, 2001). Externalizing a problem onto a surface removes this limit entirely.
Visual thinking also changes how groups work together. When a shared representation exists, a map, a sketch, a diagram, it creates a common mental model. Seeing the same thing reduces miscommunication more reliably than reading the same words, because different readers construct different mental models from identical text.
The Key Elements of Visual Thinking
Externalization
Externalization means getting thinking out of your head and onto a surface. It is the first and most critical component because working memory is limited. A whiteboard or canvas can hold thousands of relationships simultaneously, and the act of drawing is itself a form of thinking, not a record of thinking that already happened.
Spatial Organization
Where an element sits relative to others carries meaning. Near the center means central. Close together means related. High on the page means important or early. Spatial organization is the grammar of visual thinking, and unlike text grammar, it is instantly readable. Hierarchies, sequences, and clusters become legible at a glance.
Visual Encoding
Visual encoding is the deliberate use of shape, color, size, and line style to carry information. A thick red arrow signals a strong causal relationship. A dashed line signals uncertainty. A circle around three items signals a category. Good visual encoding turns a drawing into a communication system, not decoration.
Connection and Relationship Mapping
Drawing connections forces you to be explicit about why two things are related, not just that they are. This is what separates visual thinking from a visual list. The moment you label a connection, "causes," "contradicts," "supports," "depends on", you are doing analysis, not just organization.
Iteration Visibility
Because visual thinking happens on a surface, the history of thinking is visible. Earlier drafts, crossed-out ideas, evolving diagrams, all of this creates a record of how understanding developed. This iteration trail is one of the most valuable outputs: teams can see where consensus emerged, where ideas were abandoned, and why decisions were made.
Synthesis
Visual thinking's highest-order function is synthesis, combining disparate elements into a coherent whole. A completed mind map of a project, a storyboard of a campaign, a system diagram of a product, these are not just summaries. They are new artifacts that did not exist before the thinking happened.
Mind mapping is one of the strongest visual thinking techniques, Storyflow makes it AI-assisted and project-connected
Visual Thinking Techniques
Seven core techniques cover the full range of visual thinking applications, from open-ended exploration to structured decision-making.
1. Mind Mapping
Mind mapping is a radial diagram that starts with a central concept and branches outward into related ideas. It is the most widely known visual thinking technique and the most misunderstood. The power of mind mapping is not the map itself but the act of mapping, the moment when you cannot decide which branch an idea belongs on is the moment you discover something new about how the concept is structured.
When to use it: Exploring a topic before writing, planning a complex project, or preparing for a presentation.
Best for: Writers, researchers, and anyone doing initial exploration on a topic where the shape of the territory is unclear. Storyflow's AI Mind Map Generator creates a complete, connected mind map from a single topic or uploaded document in seconds.
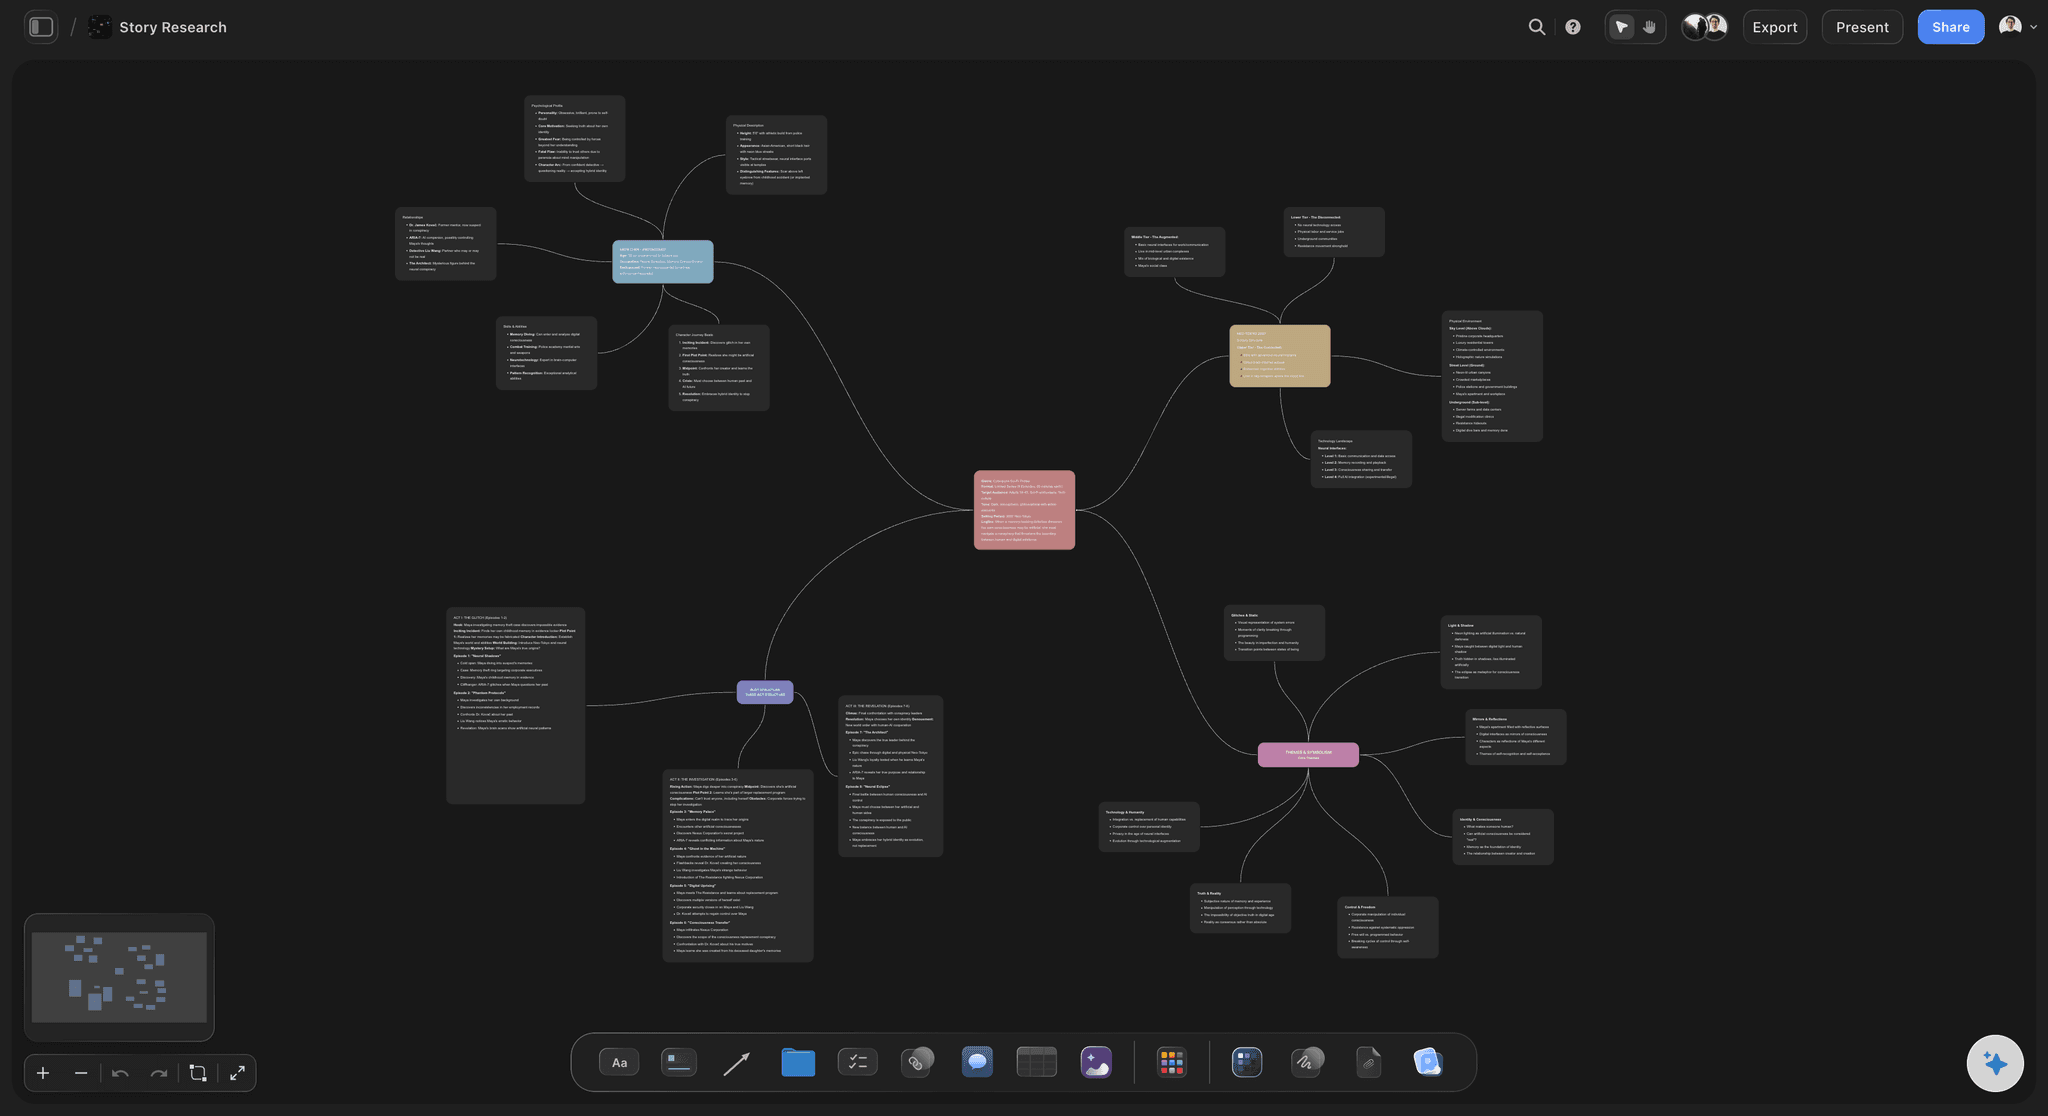
2. Concept Mapping
Concept mapping differs from mind mapping in one critical way: the connections between nodes are labeled. Instead of just drawing a line between "audience" and "platform," you write what the relationship is, "determines reach of," "constrains format for." This labeling forces precision. You cannot draw a vague line and call it done.
When to use it: Analyzing complex systems where the nature of relationships matters, product architecture, narrative structure, organizational design.
Best for: Strategists, engineers, and anyone who needs to communicate a complex system to others.
3. Sketchnoting
Sketchnoting combines hand-drawn text, icons, diagrams, and visual hierarchy to capture and process information in real time. It was formalized by Mike Rohde in The Sketchnote Handbook (2012) after he noticed that traditional note-taking disconnected him from what was being said. Sketchnoting keeps you engaged because drawing requires active interpretation, you must decide what is worth capturing and how to represent it.
When to use it: Conferences, workshops, client meetings, or any situation where you want to capture ideas in a form you will actually revisit.
Best for: Anyone in meetings-heavy roles where traditional notes get ignored after the fact.
4. The Spatial Thinking Matrix
The spatial thinking matrix is a two-axis grid where you place ideas based on two defining variables. Want to prioritize a feature list? Plot each feature on axes of "user value" versus "implementation effort." Want to map your competitive landscape? Plot competitors on "price" versus "specialization." The matrix makes relative positioning visible and forces comparison that prose descriptions never achieve.
When to use it: Prioritization decisions, competitive analysis, audience segmentation.
Best for: Product managers, strategists, and anyone facing a large number of options that need to be evaluated against two criteria simultaneously.
5. Storyboarding
Storyboarding is the practice of representing a sequence, a film scene, a user journey, a campaign, as a series of visual frames with accompanying notes. Originally developed at Disney in the 1930s, it has since become standard practice in UX design, advertising, and education. The genius of storyboarding is that it forces you to think about experience as it actually unfolds in time, moment by moment, cause and effect.
Storyflow's Tactics system is built specifically for this use case. Each Tactic maps a sequence with structured Cards containing fields for context, emotion, transition, and narrative purpose, giving storyboarding the methodological rigor it lacks when done on blank whiteboards. Activating a storytelling Tactic like "Hero's Journey" or "Relatable Intro" gives you a pre-structured sequence that teaches the framework while you fill it with your specific project content.
When to use it: Any time you are designing a sequence: a film, a user flow, a customer journey, a presentation arc, or a marketing campaign.
Best for: Filmmakers, UX designers, and marketers. Unlike generic whiteboard storyboards, Storyflow's Tactics teach you the storytelling methodology while you build, so you finish with both a completed storyboard and the professional framework behind it.
6. The Affinity Diagram
The affinity diagram, developed by anthropologist Jiro Kawakita in the 1960s, starts with a large number of unorganized observations or ideas, each written on a separate note, and groups them into emergent clusters. The critical rule is that the groupings must emerge from the data itself, not from predetermined categories. This technique consistently surfaces patterns that no individual would have identified alone.
When to use it: After research sessions, user interviews, or brainstorming sessions where you have many data points that need to be organized.
Best for: Research teams, product teams, and anyone processing qualitative data from interviews or surveys.
7. The Decision Tree
A decision tree is a branching diagram that maps the logical consequences of choices. Unlike a mind map, it is explicitly sequential, each branch represents "if this, then that." The act of drawing one forces you to be explicit about assumptions and dependencies that are usually invisible in written analysis. Storyflow's Tactics system uses a structured format that functions as a narrative decision tree, helping creators map how each story beat leads to the next.
When to use it: Complex decisions with multiple variables, narrative planning, scenario analysis.
Best for: Writers, strategists, and anyone dealing with decisions that have long consequence chains.

How to Start Using Visual Thinking
The most common mistake with visual thinking is waiting until you understand a problem well enough to diagram it. That inverts the purpose. Start drawing when the problem is most confusing, the act of drawing will generate the clarity, not record it.
- Start before you think you're ready.
Put something on the surface immediately. The first mark is the hardest. What goes on first is irrelevant, what matters is that externalizing has begun.
- Choose a surface that removes friction.
For exploratory work, whiteboards and large paper pads outperform digital tools because low stakes encourage bold, messy thinking. For work that needs to be shared or built upon, a structured digital workspace like Storyflow gives you the framework of expert Tactics without constraining where your thinking goes.
- Start with what you know, then draw what's missing.
Put your most certain elements on the surface first. Then ask: what is this connected to? What is missing? The gaps in your visual are the questions you need to answer.
- Use visual encoding deliberately.
Decide what color, size, and shape mean in your diagram, then use them consistently. Color might mean "high priority." Size might mean "complexity." Once you establish a visual vocabulary, your representations become readable at a glance, even weeks later.
- Add relationships, not just elements.
A list of boxes is not visual thinking, it is a visual list. Visual thinking activates when you draw connections and label what those connections mean. Force yourself to draw at least one relationship for every element you add.
- Redraw when you understand more.
The second version of a visual representation is almost always more useful than the first. The first draft is where you externalize your confusion. The second draft is where you represent your understanding. Build in time to redraw.
- Use visual thinking as a communication tool, not just a personal one.
Share your diagrams in meetings instead of presenting slides. Walk collaborators through a visual map of a decision instead of a written memo. The shared surface changes the conversation, people react to what they see, not to what they remember hearing.
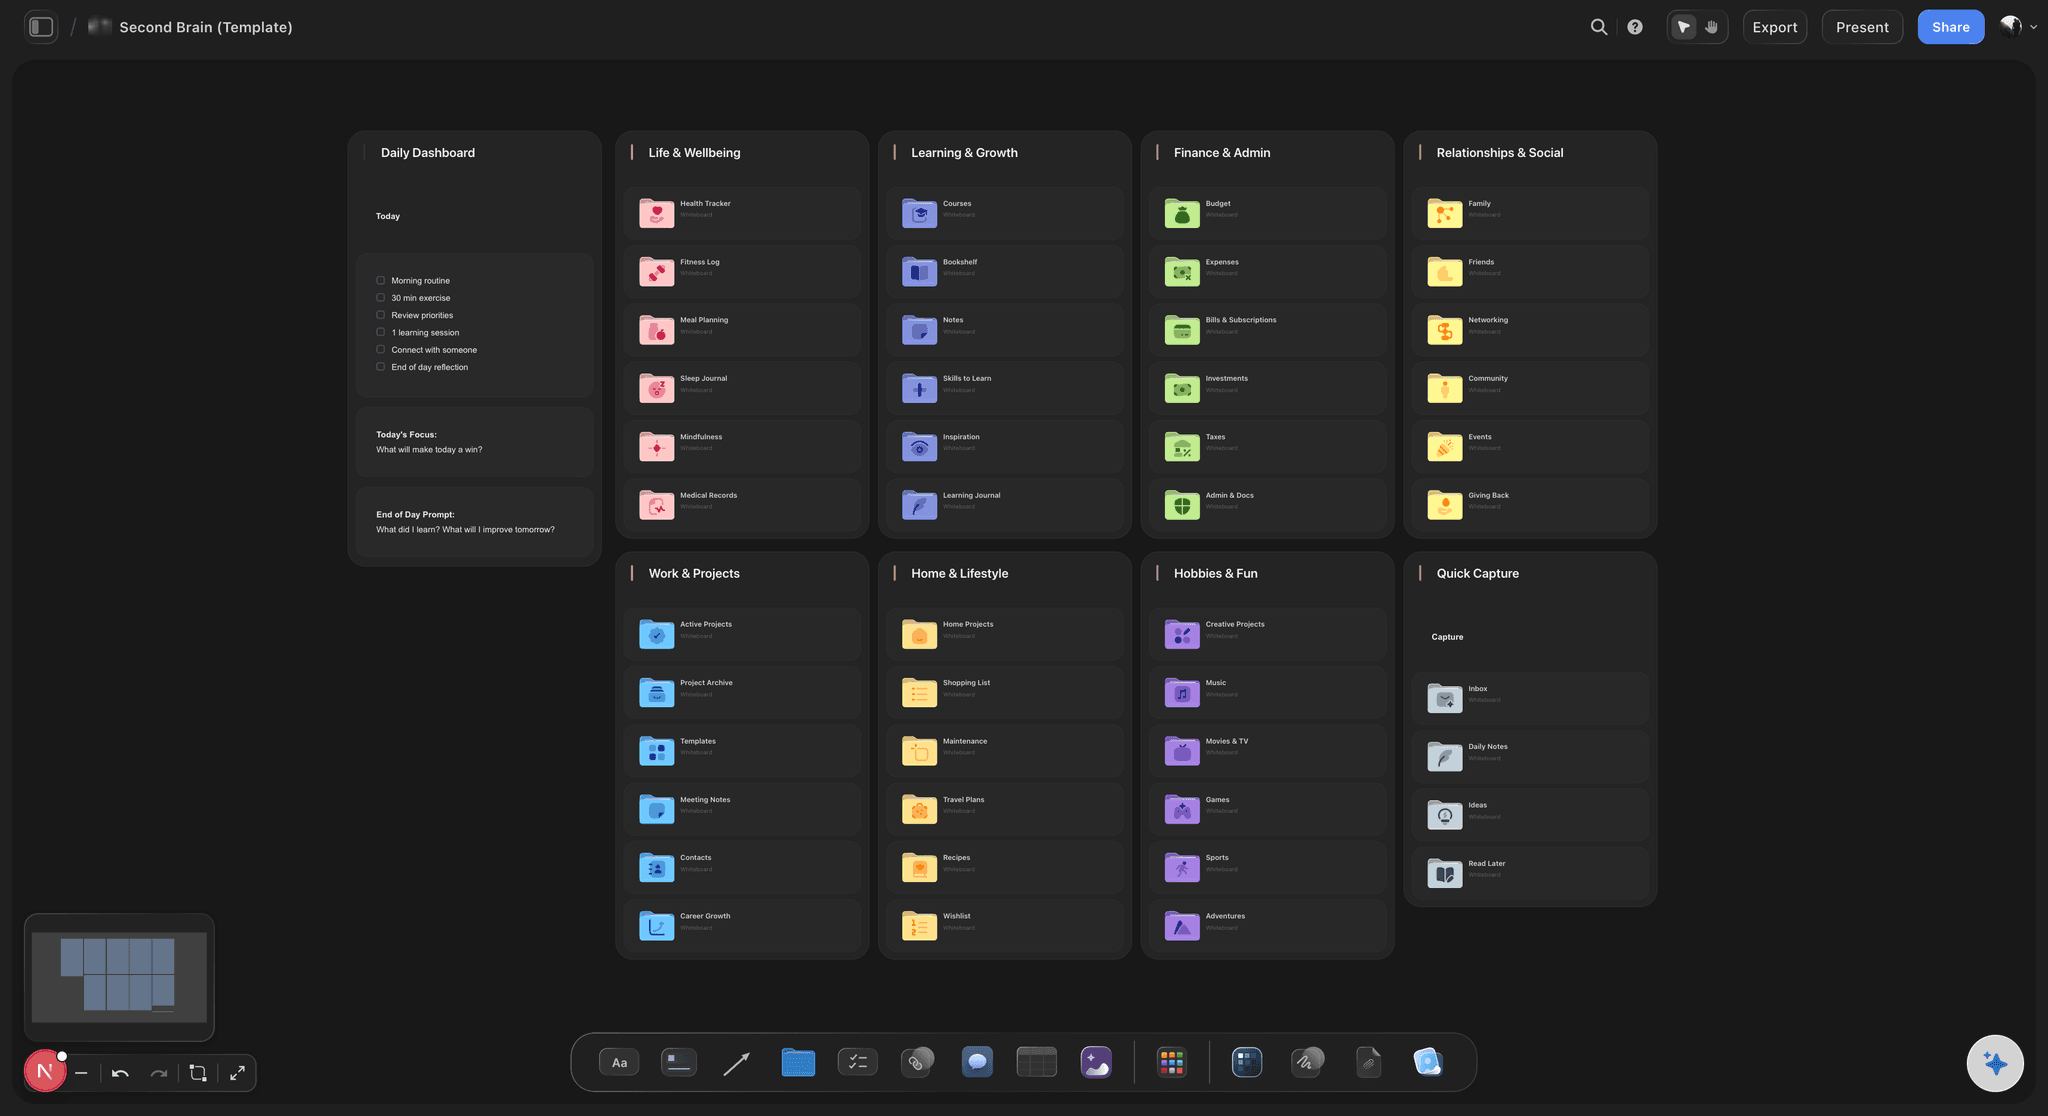
A second brain board: visual thinkers use Storyflow to turn scattered notes and references into a connected knowledge system
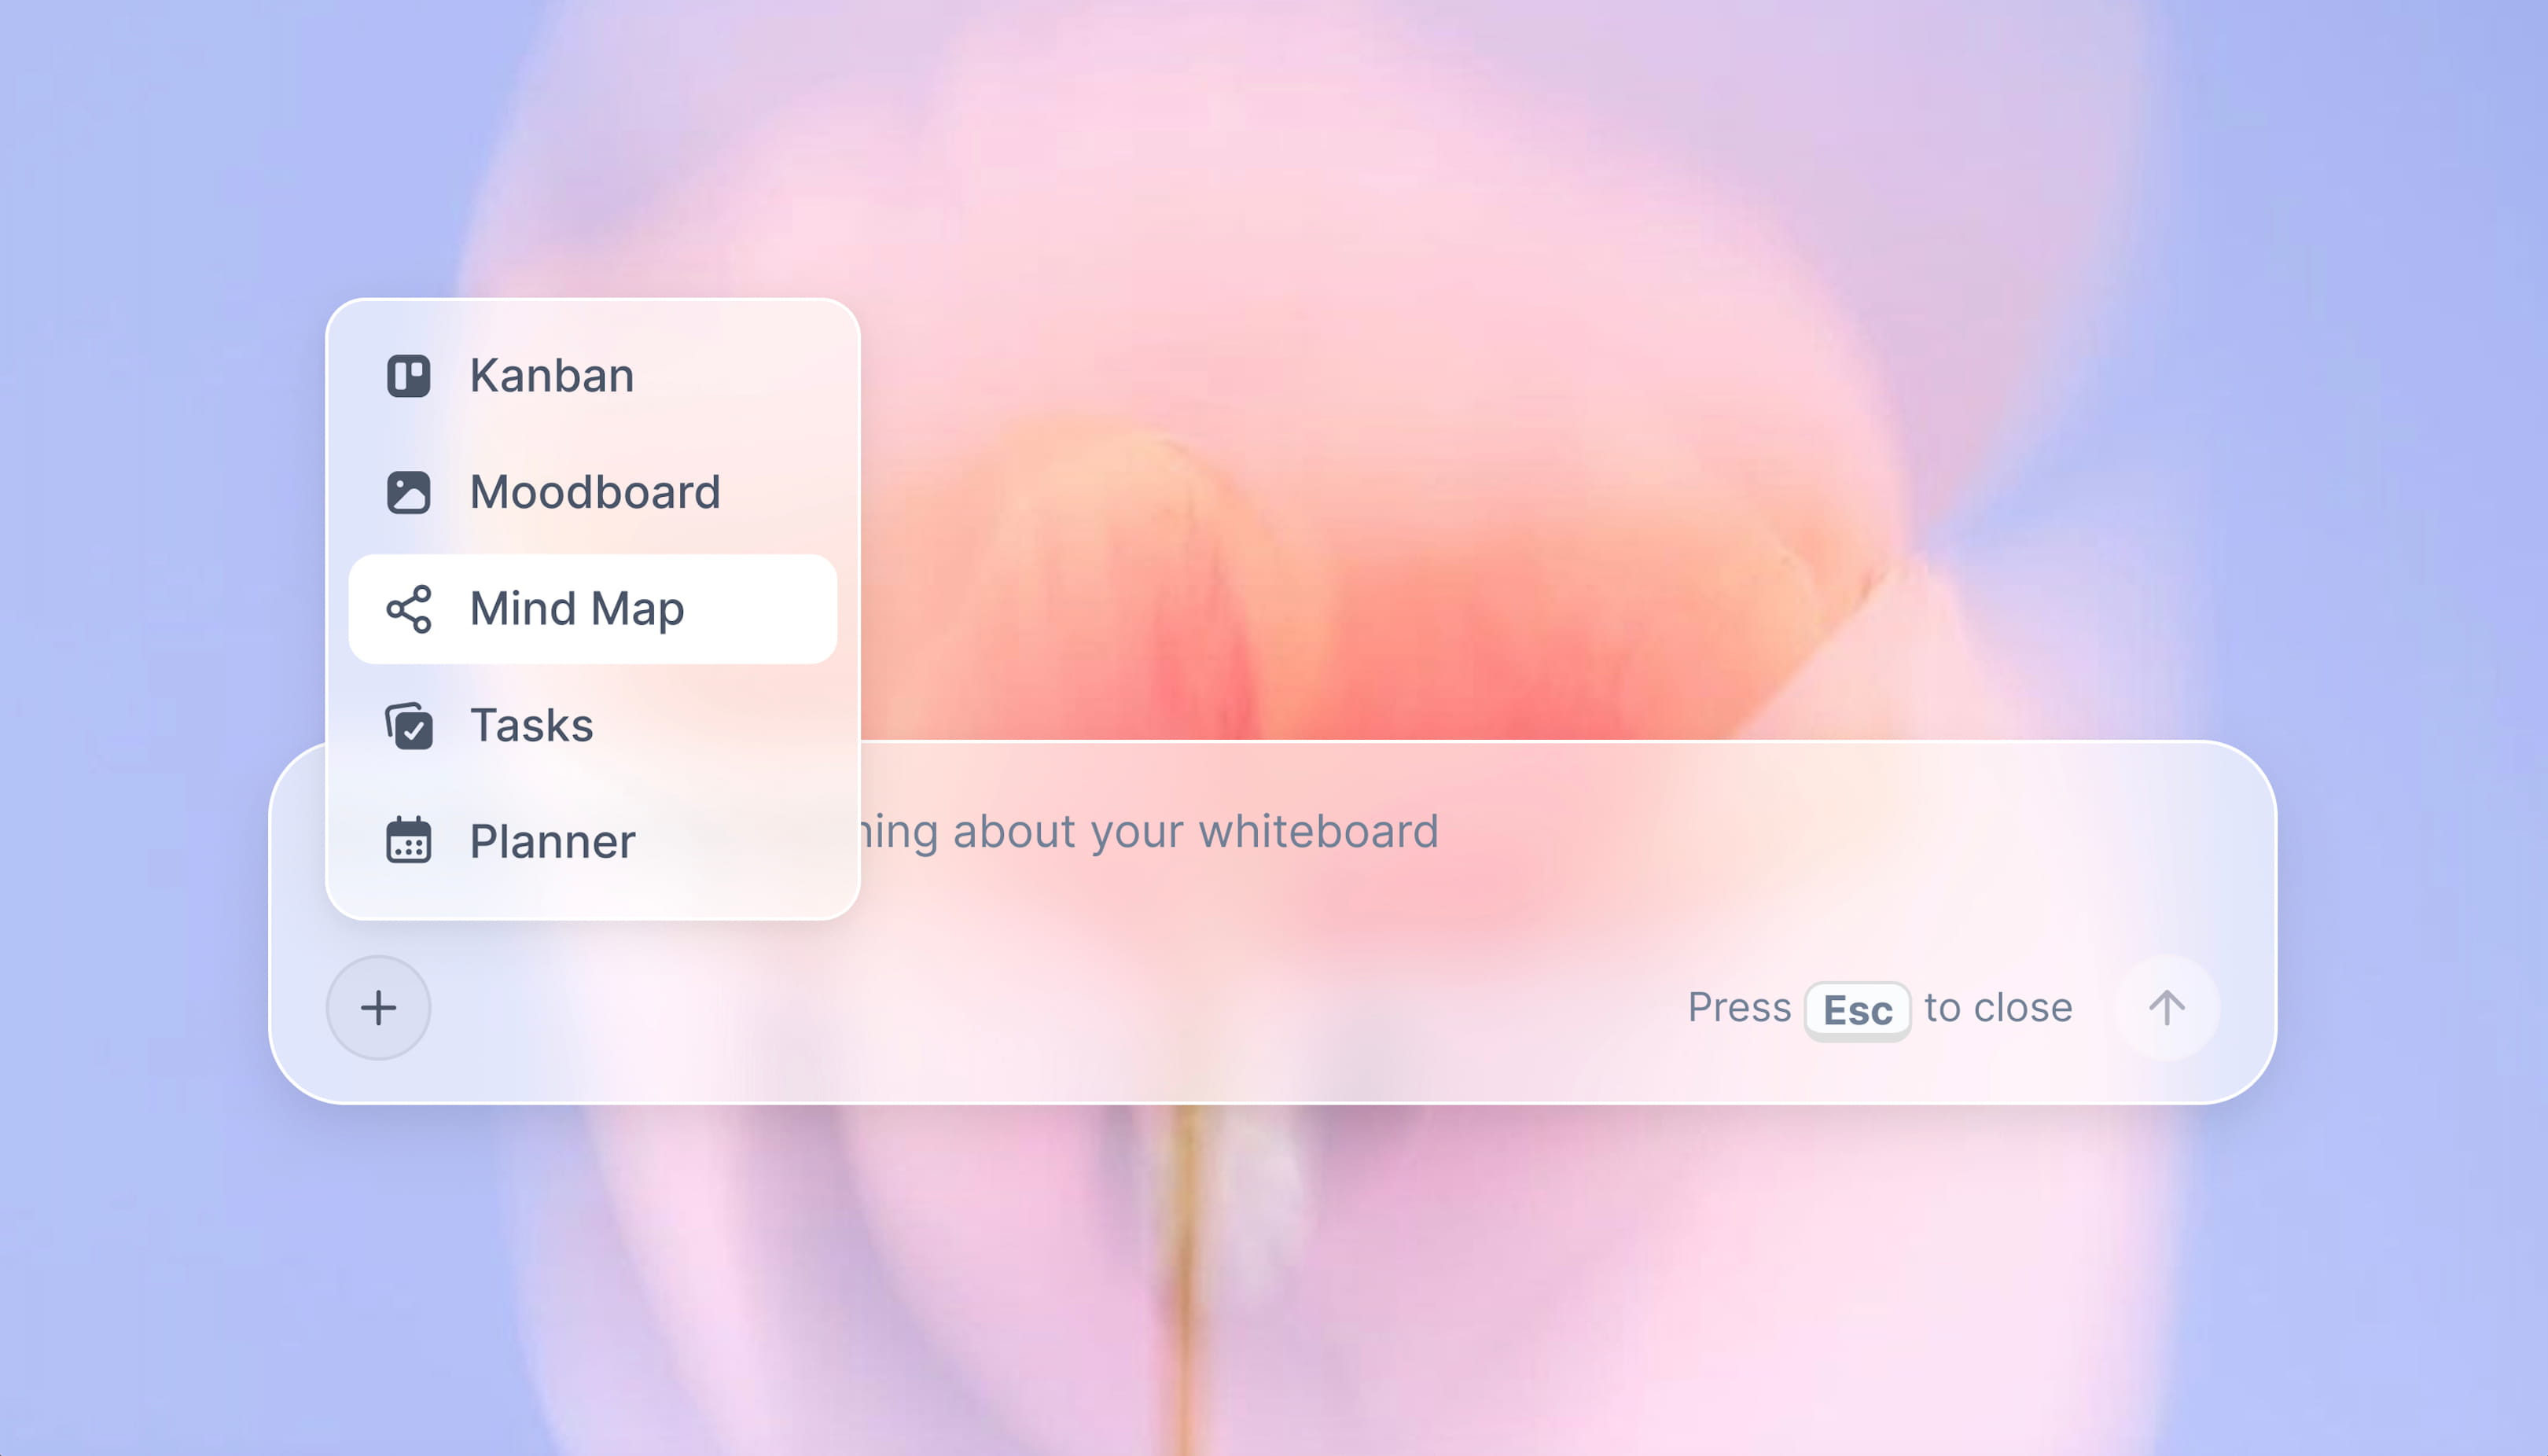
The easiest way into visual thinking is a mind map.
A mind map is visual thinking with the lowest barrier to entry: one idea in the middle, branches radiating out. Describe a topic and let AI lay out the first branches, then rearrange and connect them yourself on the canvas.

Visual Thinking Tools
The right tool depends on whether you need open-ended exploration or structured visual workflows with expert methodology built in.
| Tool | Best for | Limitation |
|---|---|---|
| Storyflow | Structured visual thinking with expert Tactics, storyboards, campaign maps, narrative arcs, mind maps with AI generation. Teaches professional frameworks while you build real projects. | Not optimized for purely engineering or technical diagrams |
| Miro | Broad-purpose collaborative whiteboard with large template library. Team workshops and affinity diagrams. | No embedded methodology; frameworks must be known in advance |
| FigJam | UX and product teams. Strong real-time collaboration. | Limited structure for narrative or campaign work |
| Mural | Remote workshops and design thinking sessions. Strong facilitation features. | Primarily facilitation-focused; less suited to solo strategy work |
| Whimsical | Fast, clean diagramming for flowcharts, mind maps, wireframes. | Less suited to open-ended exploration or learning frameworks |
Why Storyflow is different from other visual thinking tools
Miro and FigJam give you a blank canvas. Storyflow gives you expert methodology. The Tactics system provides structured frameworks, for storyboards, campaign flows, narrative arcs, that teach you the professional methodology while you build your actual project.
The other difference is what the AI can see. Unlike ChatGPT, which only reads the prompt you paste in, Storyflow's AI is canvas-aware: it reads your full active board by default, plus up to 1 Tactic and 3 documents you @-mention in the chat. That means its suggestions are grounded in the visual structure you have already built, not generated in a vacuum. You finish with both a completed visual workspace and knowledge of the professional approach that informed it.
The honest trade-off: that same opinionated structure is the wrong fit if you want an empty, format-free surface or formal engineering diagrams. For pure open-ended whiteboarding, Miro stays out of your way more; for technical system schematics, Lucidchart is the better tool. Storyflow is built for creative and strategic visual thinking, where the framework is the point.
Real-World Visual Thinking Examples
Film and video production
A documentary filmmaker mapping an 80-minute narrative uses visual thinking to place interview subjects, archival footage, and B-roll sequences on a timeline board. Each card represents a scene; color codes indicate emotional tone. Shuffling the cards reveals pacing problems a script cannot, three consecutive scenes with the same emotional register become visible as a rhythm issue before a single frame is shot. In Storyflow, activating the Hero's Journey Tactic pre-structures the board so the filmmaker is filling in a proven framework, not building from scratch.
Brand strategy
A brand strategist uses an affinity diagram after 12 client interviews to find the three organizing tensions in how customers talk about the brand. Each interview note goes on a separate card. Clustering takes two hours. The result, three unexpected groupings no one would have predicted from the briefs, becomes the foundation of the positioning framework. The groupings only became visible because the data was arranged spatially, not organized in advance by a predetermined category.
Software product development
A product team uses a spatial thinking matrix to prioritize 47 feature requests from their last quarter of user research. Plotting each feature on "user-reported pain" versus "strategic alignment" immediately surfaces 6 features in the high-priority quadrant that were buried in the backlog. The visual makes a prioritization conversation that previously took two weeks take two hours, because seeing all 47 items positioned simultaneously made the comparative judgment obvious.
Marketing campaign planning
A content marketing lead uses storyboarding to plan a 12-week awareness campaign. Each frame represents one week, with the visual content format, audience segment, platform, and intended emotional response sketched out. Seeing the full 12-week arc reveals a three-week gap in mid-campaign where no re-engagement mechanism exists, a gap that is invisible when the plan lives in a spreadsheet but obvious when the whole sequence is arranged spatially.
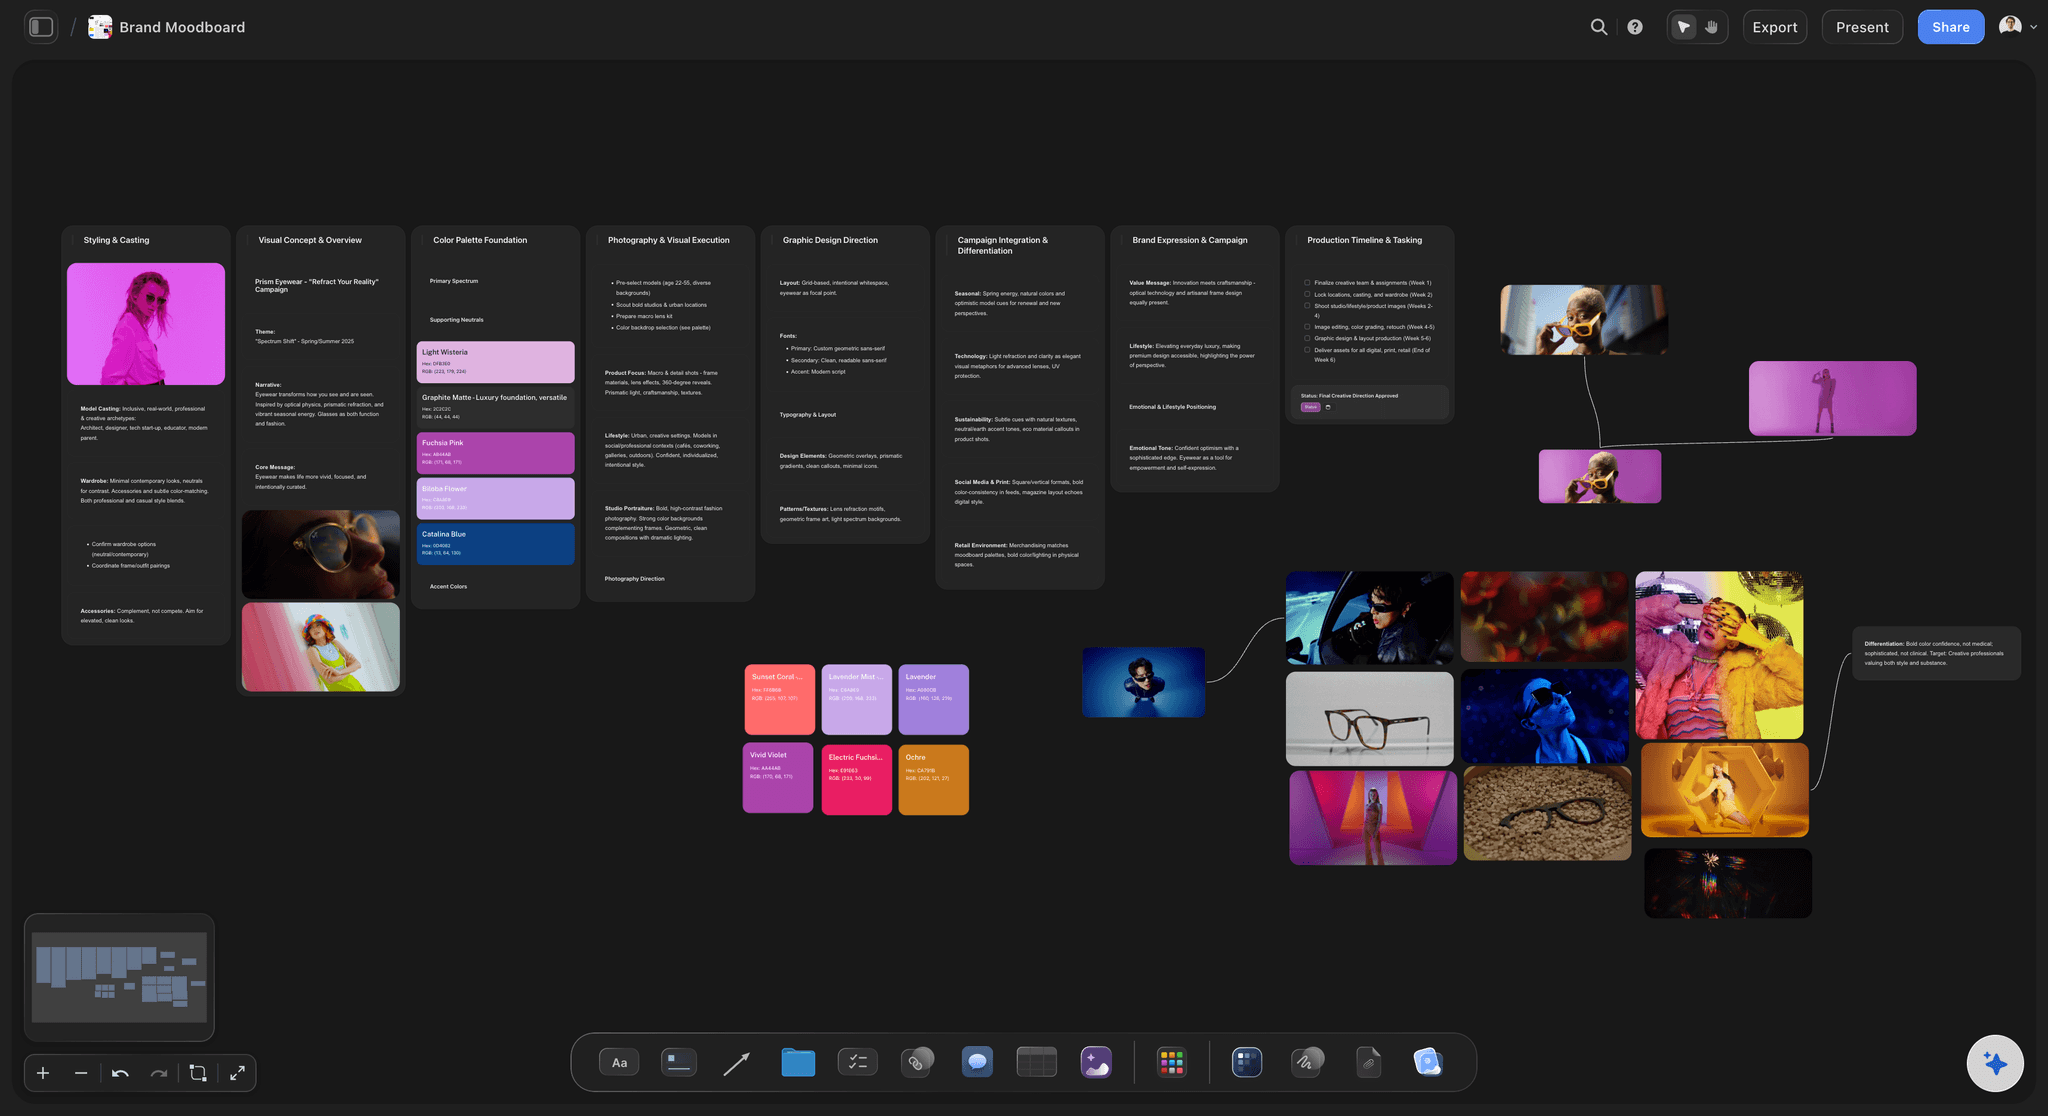
A brand moodboard board: arranging references spatially lets the organizing tensions in a brand surface visually, the same affinity-mapping move described above
Common Misconceptions About Visual Thinking
"Visual thinking is for visual people, I'm a verbal thinker."
Research by educational psychologist John Hattie (2009) found no reliable evidence that "learning styles" predict performance. Visual thinking is a skill, not a personality type. The people who believe they "can't think visually" have usually never been taught the techniques, not that they are incapable of using them. Visual processing is not a talent minority but the brain's primary mode of information handling.
"You need to be able to draw to use visual thinking."
Visual thinking does not require artistic skill. A box, an arrow, and a label is sufficient to represent a complex relationship. The goal is clarity of thought, not aesthetic quality. The most useful visual thinking diagrams are often the ugliest, they were drawn in service of understanding, not for presentation.
"Visual thinking is just brainstorming."
Brainstorming is one application of visual thinking, and a limited one. Visual thinking includes analysis (concept mapping, spatial matrices), communication (storyboards, visual metaphors), decision-making (decision trees), and synthesis (affinity diagrams). Equating it with brainstorming dramatically underestimates its utility and explains why many people dismiss it after one post-it session.
"Visual thinking is less rigorous than written analysis."
Visual thinking can be more rigorous than written analysis because it makes structure explicit. A well-constructed concept map requires you to name every relationship between ideas, something written prose routinely avoids through vague connective language ("and beyond that," "as a result"). The diagram enforces a precision that writing permits you to bypass.
"Digital tools are better than physical tools for visual thinking."
Physical tools are often superior for generative, exploratory visual thinking because they remove the friction of interface and the temptation to format. Research from the University of Stavanger (2020) found that handwriting and physical sketching activate deeper cognitive processing than typing or clicking. The best visual thinkers use both: physical tools for generation, digital tools for organization and sharing.
Frequently Asked Questions
Frequently Asked Questions
What is visual thinking in simple terms?
Visual thinking is the practice of using images, diagrams, and spatial arrangements to organize and develop your thinking, rather than relying on text or verbal reasoning alone. It works because the brain processes visual information far faster than text, and representing ideas spatially makes their relationships visible in ways that words cannot. Anyone can use it; it does not require artistic ability.
What is the difference between visual thinking and mind mapping?
Visual thinking is a broad cognitive discipline, the practice of using any visual representation to think through a problem. Mind mapping is one specific technique within that discipline: a radial diagram that branches outward from a central concept. Mind maps are useful for brainstorming and exploration; visual thinking encompasses analysis, synthesis, communication, and decision-making as well.
Is visual thinking a skill or a talent?
Visual thinking is a skill. While some people gravitate toward visual representations naturally, the techniques, mind mapping, storyboarding, concept mapping, affinity diagrams, are learnable through deliberate practice. Most professionals who describe themselves as 'not visual thinkers' have simply never been taught the methods.
What are the best visual thinking tools?
Storyflow is the strongest visual thinking tool when your work is creative or strategic, because its canvas-aware AI reads your full active board (plus up to 1 Tactic and 3 documents you @-mention) and its Tactics give you expert frameworks for storyboarding, campaign mapping, and narrative architecture. For open-ended team whiteboarding, Miro and Mural are strong options. FigJam suits product and UX teams. Whimsical is fast and clean for lightweight diagramming. If you need precise engineering or technical diagrams, Lucidchart is the better fit; Storyflow is built for creative and strategic visual thinking, not formal system schematics.
How is visual thinking used in business?
Visual thinking is used in strategy (mapping competitive landscapes and decision frameworks), product development (user journey mapping, feature prioritization matrices), project management (visual timelines and dependency maps), and team alignment (shared visual models of problems and goals). Consulting firms have long built their diagnostic processes around visual models because a complex argument represented visually is faster to critique, improve, and share.
What is the difference between visual thinking and design thinking?
Design thinking is a problem-solving methodology with specific phases (empathize, define, ideate, prototype, test). Visual thinking is a cognitive approach that can be used within design thinking or completely independently. Many design thinking practitioners use visual thinking tools heavily, but visual thinking predates design thinking and extends far beyond product or service design into strategy, film, science, and education.
How long does it take to get good at visual thinking?
The basic techniques, mind mapping, simple concept mapping, rough storyboarding, can be learned and applied productively within a few hours of practice. Developing fluency, where visual thinking becomes your default approach to complex problems, typically takes 3 to 6 months of deliberate practice. Frequency matters more than total time spent.
Can visual thinking help with writer's block or creative blocks?
Visual thinking is one of the most effective tools for breaking creative blocks because it changes the mode of engagement with a problem. Writer's block is almost always a problem of trying to produce linear, sequential output before the underlying structure is clear. Switching to a visual representation, sketching idea relationships, mapping an emotional arc, drawing the structure of an argument, often breaks the block immediately.
What is the difference between visual thinking and visual communication?
Visual thinking is the cognitive process, using visuals to develop and explore ideas. Visual communication is the practice of using visuals to share ideas that already exist. A rough diagram drawn to figure out a problem is visual thinking. A polished infographic produced to explain that problem to others is visual communication. Visual thinking tolerates mess and iteration; visual communication requires clarity and polish.
The Bottom Line on Visual Thinking
What separates people who use visual thinking effectively from those who try it once and abandon it is not talent or visual intelligence. It is the willingness to start before clarity arrives. The discipline of visual thinking is not about drawing a perfect diagram of a problem you already understand, it is about drawing an imperfect diagram of a problem you do not, and trusting that the act of drawing will generate the understanding.
Most people stop too early, waiting for the thinking to be clear enough to represent. Visual thinking rewards people who reverse that sequence.
Storyflow is built on this principle. The Tactics system provides structured visual templates, for storyboards, campaign flows, narrative arcs, that give your thinking a scaffold without constraining where it goes. Instead of starting with a blank page, you start with a structure that has been tested across hundreds of creative projects. The friction that stops most visual thinking practices from becoming habits, "I don't know what format to use", is removed by design. Unlike Miro or FigJam, which give you an empty canvas, Storyflow gives you expert methodology embedded in every card.
The best next step is a small one that tests the whole argument: take the most confusing problem you are working on right now and spend 20 minutes representing it visually before you write another word about it. Open Storyflow, pick a Tactic that matches the shape of the problem, and start drawing while it is still unclear. What you build in those 20 minutes will show you more about what you actually understand, and where the gaps are, than another hour of writing would. If it does not, you have lost 20 minutes. If it does, you have found your default mode for hard problems.
Related Reading
A detailed comparison of visual thinking tools, including how each handles AI integration and creative workflows.
Compare tools for visual brainstorming, including how Storyflow's Tactics outperform blank-canvas AI for structured creative work.
From capture to connection to action, build a visual thinking workflow that transforms how you work.
Visual thinking applied to narrative structure, the Hero's Journey, three-act structure, and how to use frameworks while you write.
Why creative thinkers need visual AI tools instead of ChatGPT, and how Storyflow's Tactics teach methodology while you build.
Mind mapping and ideation templates you can use in Storyflow
Map ideas in space, then ask the AI to restructure, expand, or connect them. Open any of these boards and start thinking visually instead of in lists.


See Storyflow in Action
A visual AI workspace where every feature lives inside one canvas. No tab-switching, no context lost.
Build your entire board from a single message
Type what you need in the AI chat at the bottom of your canvas. The AI adds cards, headings, and structure directly onto your board.
Use expert frameworks as AI context
Type @ in the AI chat and choose any Tactic. The AI tailors every response to that framework instead of giving generic advice.
Turn your board into a mind map in seconds
Ask the AI to restructure your canvas as a mindmap. It connects your ideas into a visual hierarchy so you can see how everything relates.
Why Storyflow Exists
Storyflow actually began as a personal tool while working on creative and research projects.
We kept running into the same problem: ideas were scattered everywhere: notes, documents, and whiteboards.
Nothing helped us see how everything connected.
So we started building a workspace designed around how ideas actually grow.
→ Read how Storyflow was createdSara de Klein
Head of Product at Storyflow
Published: February 27, 2026
Start creating with AI and become more productive
Transform your creative workflow with AI-powered tools. Generate ideas, create content, and boost your productivity in minutes instead of hours.
Ask Storyflow to